11.2 颜色模式
不同的颜色模式,从 RGB 到 HCL 的基本操作 https://stat545.com/block018_colors.html
# https://github.com/hadley/ggplot2-book
hcl <- expand.grid(x = seq(-1, 1, length = 100), y = seq(-1, 1, length = 100)) |>
  subset(subset = x^2 + y^2 < 1) |>
  transform(
    r = sqrt(x^2 + y^2)
  ) |>
  transform(
    h = 180 / pi * atan2(y, x),
    c = 100 * r,
    l = 65
  ) |>
  transform(
    colour = hcl(h, c, l)
  )

# sin(h) = y / (c / 100)
# y = sin(h) * c / 100

cols <- scales::hue_pal()(5)
selected <- colorspace::RGB(t(col2rgb(cols)) / 255) %>%
  as("polarLUV") %>%
  colorspace::coords() %>%
  as.data.frame() %>%
  transform(
    x = cos(H / 180 * pi) * C / 100,
    y = sin(H / 180 * pi) * C / 100,
    colour = cols
  )

ggplot(hcl, aes(x, y)) +
  geom_raster(aes(fill = colour)) +
  scale_fill_identity() +
  scale_colour_identity() +
  coord_equal() +
  scale_x_continuous("", breaks = NULL) +
  scale_y_continuous("", breaks = NULL) +
  geom_point(data = selected, size = 10, color = "white") +
  geom_point(data = selected, size = 5, aes(colour = colour))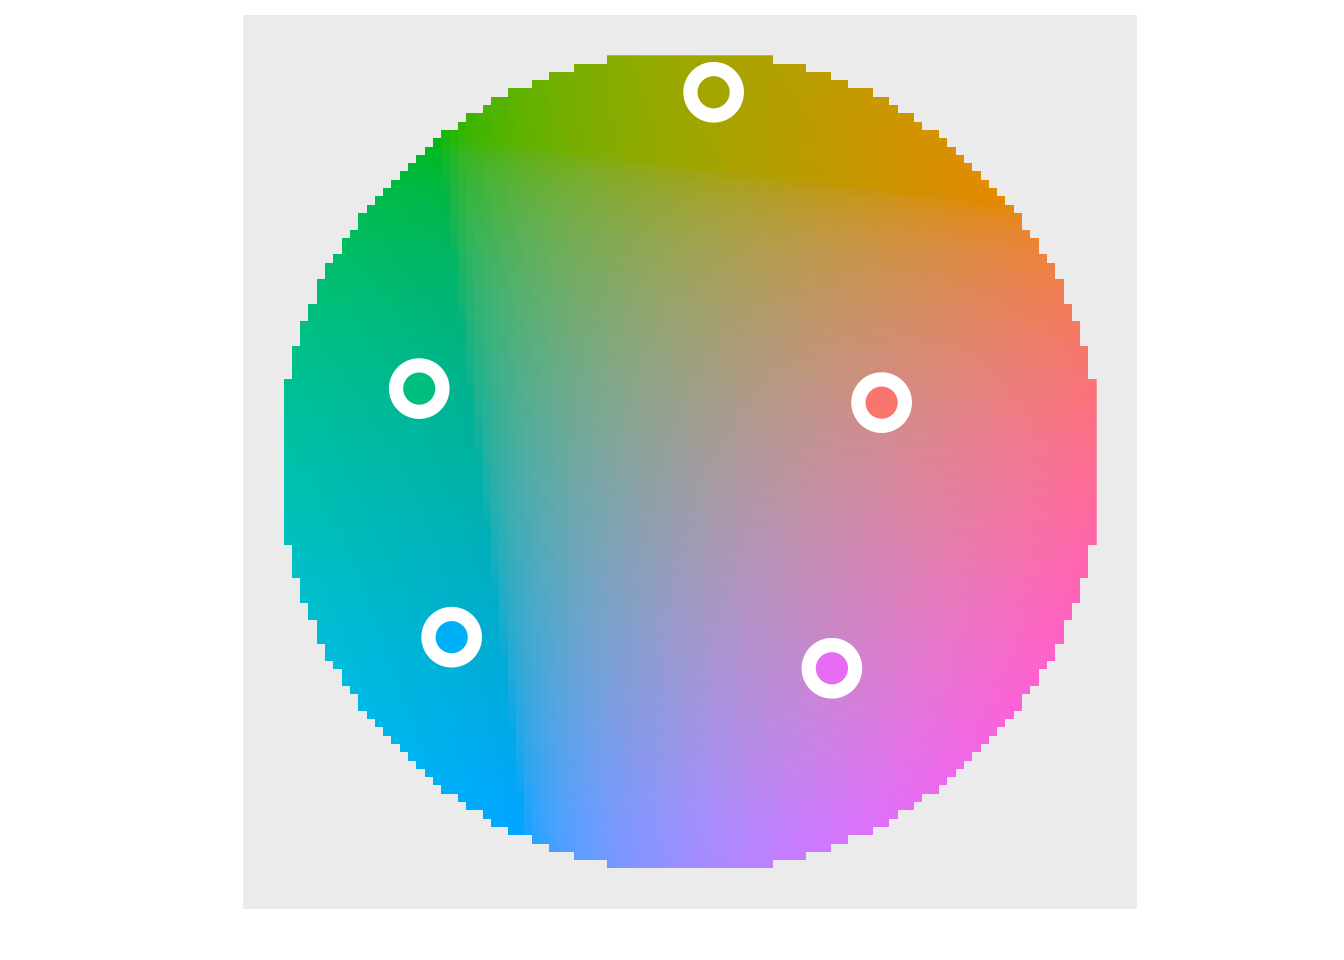
图 11.15: HCL调色
R 内置了 502 种不同颜色的名称,下面随机地选取 20 种颜色
sample(colors(TRUE), 20)## [1] "royalblue4" "plum1" "papayawhip" "darkslategray"
## [5] "darkturquoise" "gray79" "darkred" "maroon4"
## [9] "darkolivegreen4" "springgreen2" "orchid4" "lemonchiffon2"
## [13] "paleturquoise4" "gray49" "cyan" "antiquewhite1"
## [17] "yellow2" "gray13" "cadetblue2" "gray77"R 包 grDevices 提供 hcl 调色板35 调制两个色板
# Colors from https://github.com/johannesbjork/LaCroixColoR
color_pal <- c("#FF3200", "#E9A17C", "#E9E4A6", "#1BB6AF", "#0076BB", "#172869")
n <- 16
more_colors <- (grDevices::colorRampPalette(color_pal))(n)
scales::show_col(colours = more_colors)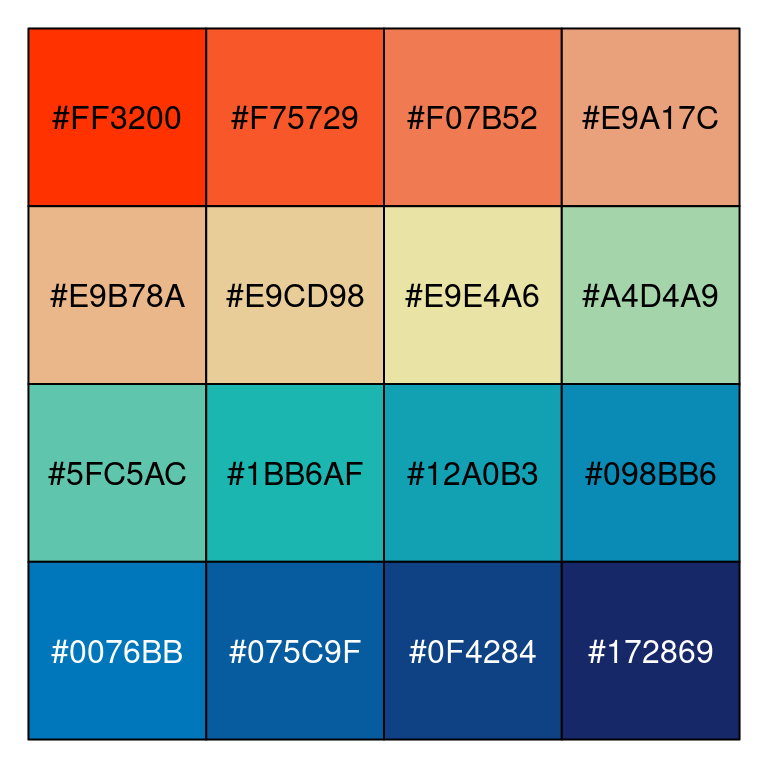
图 11.16: 桃色至梨色的渐变
# colors in colortools from http://www.gastonsanchez.com/
fish_pal <- c(
  "#69D2E7", "#6993E7", "#7E69E7", "#BD69E7",
  "#E769D2", "#E76993", "#E77E69", "#E7BD69",
  "#D2E769", "#93E769", "#69E77E", "#69E7BD"
)
more_colors <- (grDevices::colorRampPalette(fish_pal))(n)
scales::show_col(colours = more_colors)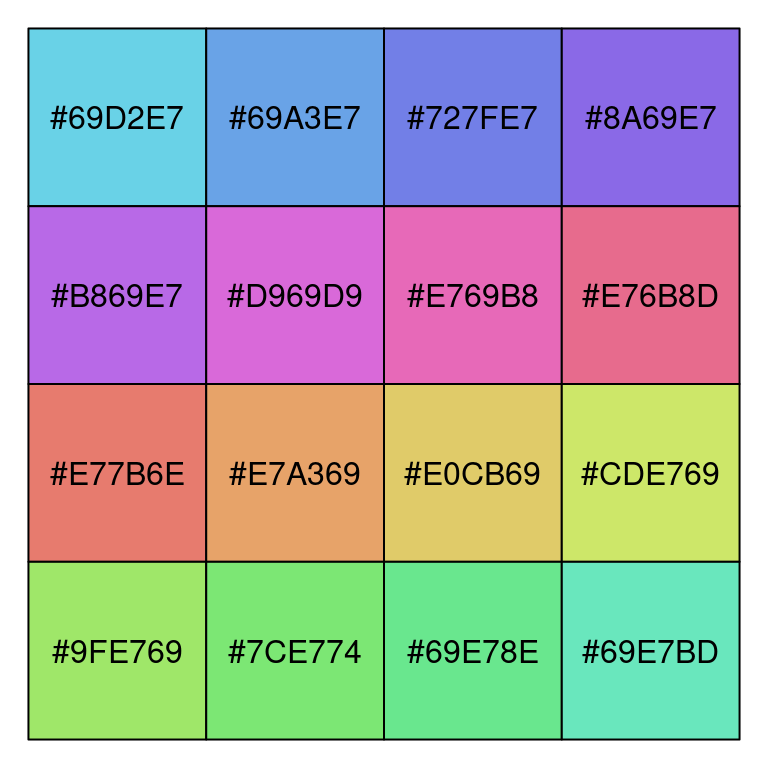
图 11.17: Hue-Saturation-Value (HSV) 颜色模型
rgb(red = 86, green = 180, blue = 233, maxColorValue = 255) # "#56B4E9"## [1] "#56B4E9"rgb(red = 0, green = 158, blue = 115, maxColorValue = 255) # "#009E73"## [1] "#009E73"rgb(red = 240, green = 228, blue = 66, maxColorValue = 255) # "#F0E442"## [1] "#F0E442"rgb(red = 0, green = 114, blue = 178, maxColorValue = 255) # "#0072B2"## [1] "#0072B2"举例子,直方图配色与不配色
# library(pander)
# evalsOptions('graph.unify', TRUE)
# panderOptions('graph.colors') 获取调色板
# https://www.fontke.com/tool/rgbschemes/ 在线配色
cols <- c(
  "#56B4E9", "#009E73", "#F0E442", "#0072B2",
  "#D55E00", "#CC79A7", "#999999", "#E69F00"
)
hist(mtcars$hp, col = "#56B4E9", border = "white", grid = grid())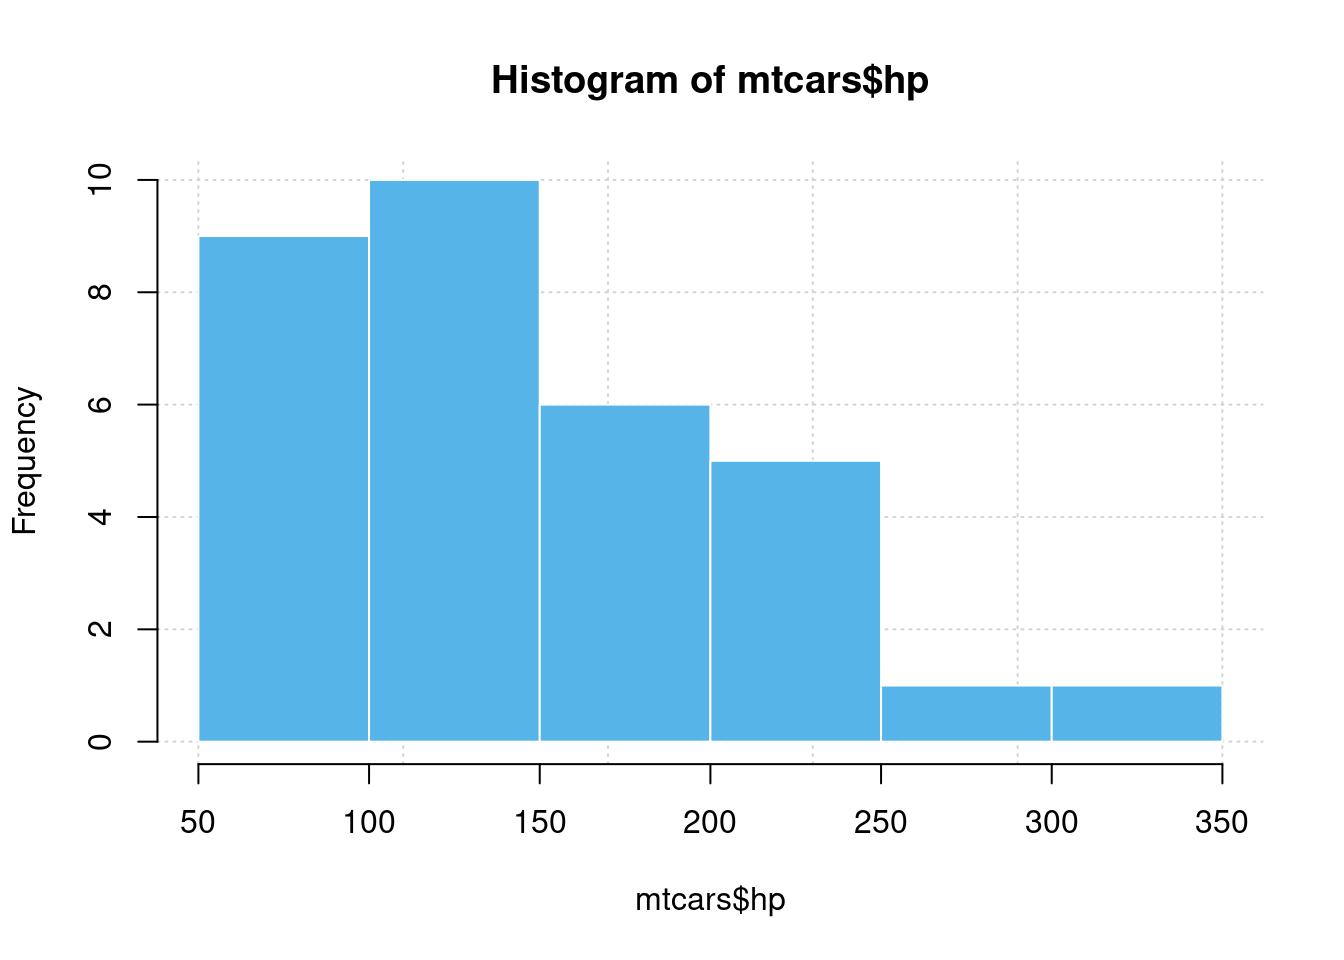
图 11.18: 直方图
ggplot(mtcars) +
  geom_histogram(aes(x = hp, fill = as.factor(..count..)),
    color = "white", bins = 6
  ) +
  scale_fill_manual(values = rep("#56B4E9", 10)) +
  ggtitle("Histogram with ggplot2") +
  theme_minimal() +
  theme(legend.position = "none")
## Warning: The dot-dot notation (`..count..`) was deprecated in ggplot2 3.4.0.
## ℹ Please use `after_stat(count)` instead.
## This warning is displayed once every 8 hours.
## Call `lifecycle::last_lifecycle_warnings()` to see where this warning was
## generated.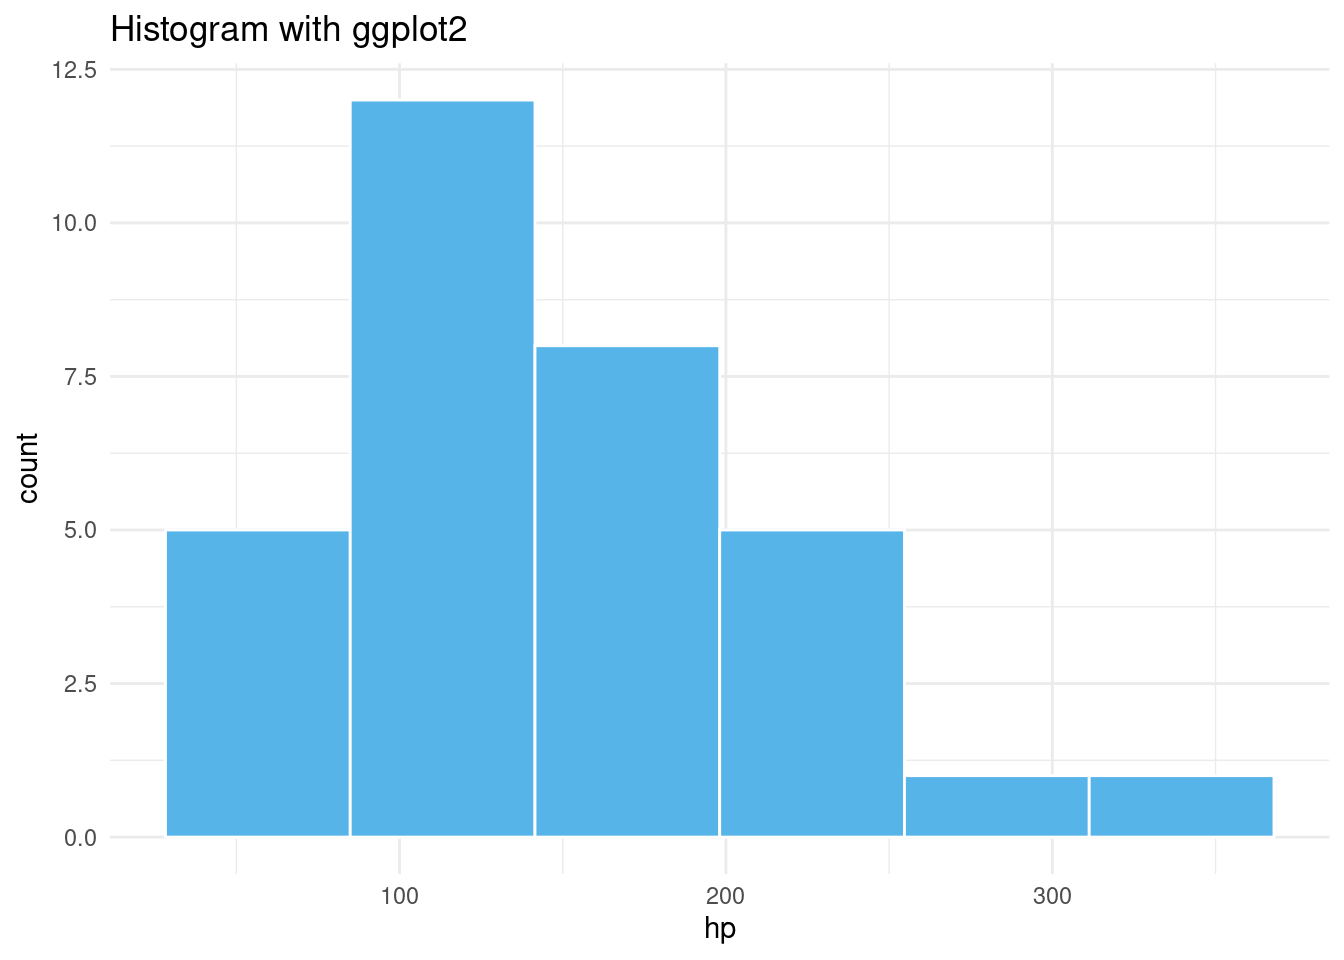
图 11.19: 直方图
11.2.1 RGB
红(red)、绿(green)、蓝(blue)是三原色
rgb(red, green, blue, alpha, names = NULL, maxColorValue = 1)函数参数说明:
red, blue, green, alpha取值范围\([0,M]\),\(M\) 是 maxColorValuenames字符向量,给这组颜色值取名maxColorValue红,绿,蓝三色范围的最大值
The colour specification refers to the standard sRGB colorspace (IEC standard 61966).
rgb 产生一种颜色,如 rgb(255, 0, 0, maxColorValue = 255) 的颜色是 "#FF0000" ,这是一串16进制数,每两个一组,那么一组有 \(16^2 = 256\) 种组合,整个一串有 \(256^3 = 16777216\) 种组合,这就是RGB表达的所有颜色。
11.2.3 HSV
Create a vector of colors from vectors specifying hue, saturation and value. 色相饱和度值
hsv(h = 1, s = 1, v = 1, alpha)This function creates a vector of colors corresponding to the given values in HSV space. rgb and rgb2hsv for RGB to HSV conversion;
hsv函数通过设置色调、饱和度和亮度获得颜色,三个值都是0-1的相对量
RGB HSV HSL 都是不连续的颜色空间,缺点
11.2.4 HCL
基于感知的颜色空间替代RGB颜色空间
通过指定色相(hue),色度(chroma)和亮度(luminance/lightness),创建一组(种)颜色
hcl(h = 0, c = 35, l = 85, alpha, fixup = TRUE)函数参数说明:
h 颜色的色调,取值范围为[0,360],0、120、240分别对应红色、绿色、蓝色
c 颜色的色度,其上界取决于色调和亮度
l 颜色的亮度,取值范围[0,100],给定色调和色度,只有一部分子集可用
alpha 透明度,取值范围[0,1],0 和1分别表示透明和不透明
This function corresponds to polar coordinates in the CIE-LUV color space
选色为什么这么难
色相与阴影相比是无关紧要的,色相对于标记和分类很有用,但表示(精细的)空间数据或形状的效果较差。颜色是改善图形的好工具,但糟糕的配色方案 (color schemes) 可能会导致比灰度调色板更差的效果。[15]
黑、白、灰,看似有三种颜色,其实只有一种颜色,黑和白只是灰色的两极,那么如何设置灰色梯度,使得人眼比较好区分它们呢?这样获得的调色板适用于什么样的绘图环境呢?
11.2.5 CMYK
印刷三原色:青 (cyan)、品红 (magenta)、黄 (yellow)
- 颜色模式转化
col2rgb() 、rgb2hsv() 和 rgb() 函数 hex2RGB() 函数 colorspace col2hcl() 函数 scales col2HSV() colortools col2hex()
col2rgb("lightblue") # color to RGB## [,1]
## red 173
## green 216
## blue 230scales::col2hcl("lightblue") # color to HCL## [1] "#ADD8E6"# palr::col2hex("lightblue") # color to HEX
# colortools::col2HSV("lightblue") # color to HSV
rgb(173, 216, 230, maxColorValue = 255) # RGB to HEX## [1] "#ADD8E6"colorspace::hex2RGB("#ADD8E6") # HEX to RGB## R G B
## [1,] 0.6784314 0.8470588 0.9019608rgb(.678, .847, .902, maxColorValue = 1) # RGB to HEX## [1] "#ADD8E6"rgb2hsv(173, 216, 230, maxColorValue = 255) # RGB to HSV## [,1]
## h 0.5409357
## s 0.2478261
## v 0.9019608