6.16 with 选项
注意 data.table 与 Base R 不同的地方
# https://github.com/Rdatatable/data.table/issues/4513
# https://d.cosx.org/d/421532-datatable-base-r
library(data.table)
iris <- as.data.table(iris)
iris[Species == "setosa" & Sepal.Length > 5.5, grepl("Sepal", colnames(iris))]## [1] TRUE TRUE FALSE FALSE FALSE需要使用 with = FALSE 选项
iris[Species == "setosa" & Sepal.Length > 5.5,
  grepl("Sepal", colnames(iris)),
  with = FALSE
]
## Sepal.Length Sepal.Width
## 1: 5.8 4.0
## 2: 5.7 4.4
## 3: 5.7 3.8不使用 with 选项,用函数 mget() 将字符串转变量
iris[
  Species == "setosa" & Sepal.Length > 5.5,
  mget(grep("Sepal", colnames(iris), value = TRUE))
]
## Sepal.Length Sepal.Width
## 1: 5.8 4.0
## 2: 5.7 4.4
## 3: 5.7 3.8更加 data.table 风格的方式见
iris[Species == "setosa" & Sepal.Length > 5.5, .SD, .SDcols = patterns("Sepal")]## Sepal.Length Sepal.Width
## 1: 5.8 4.0
## 2: 5.7 4.4
## 3: 5.7 3.8with 还可以这样用,直接修改、添加一列
df <- expand.grid(x = 1:10, y = 1:10)
df$z <- with(df, x^2 + y^2)
df <- subset(df, z < 100)
df <- df[sample(nrow(df)), ]
head(df)
## x y z
## 7 7 1 50
## 8 8 1 65
## 65 5 7 74
## 14 4 2 20
## 37 7 4 65
## 5 5 1 26library(ggplot2)
ggplot(df, aes(x, y, z = z)) +
geom_contour()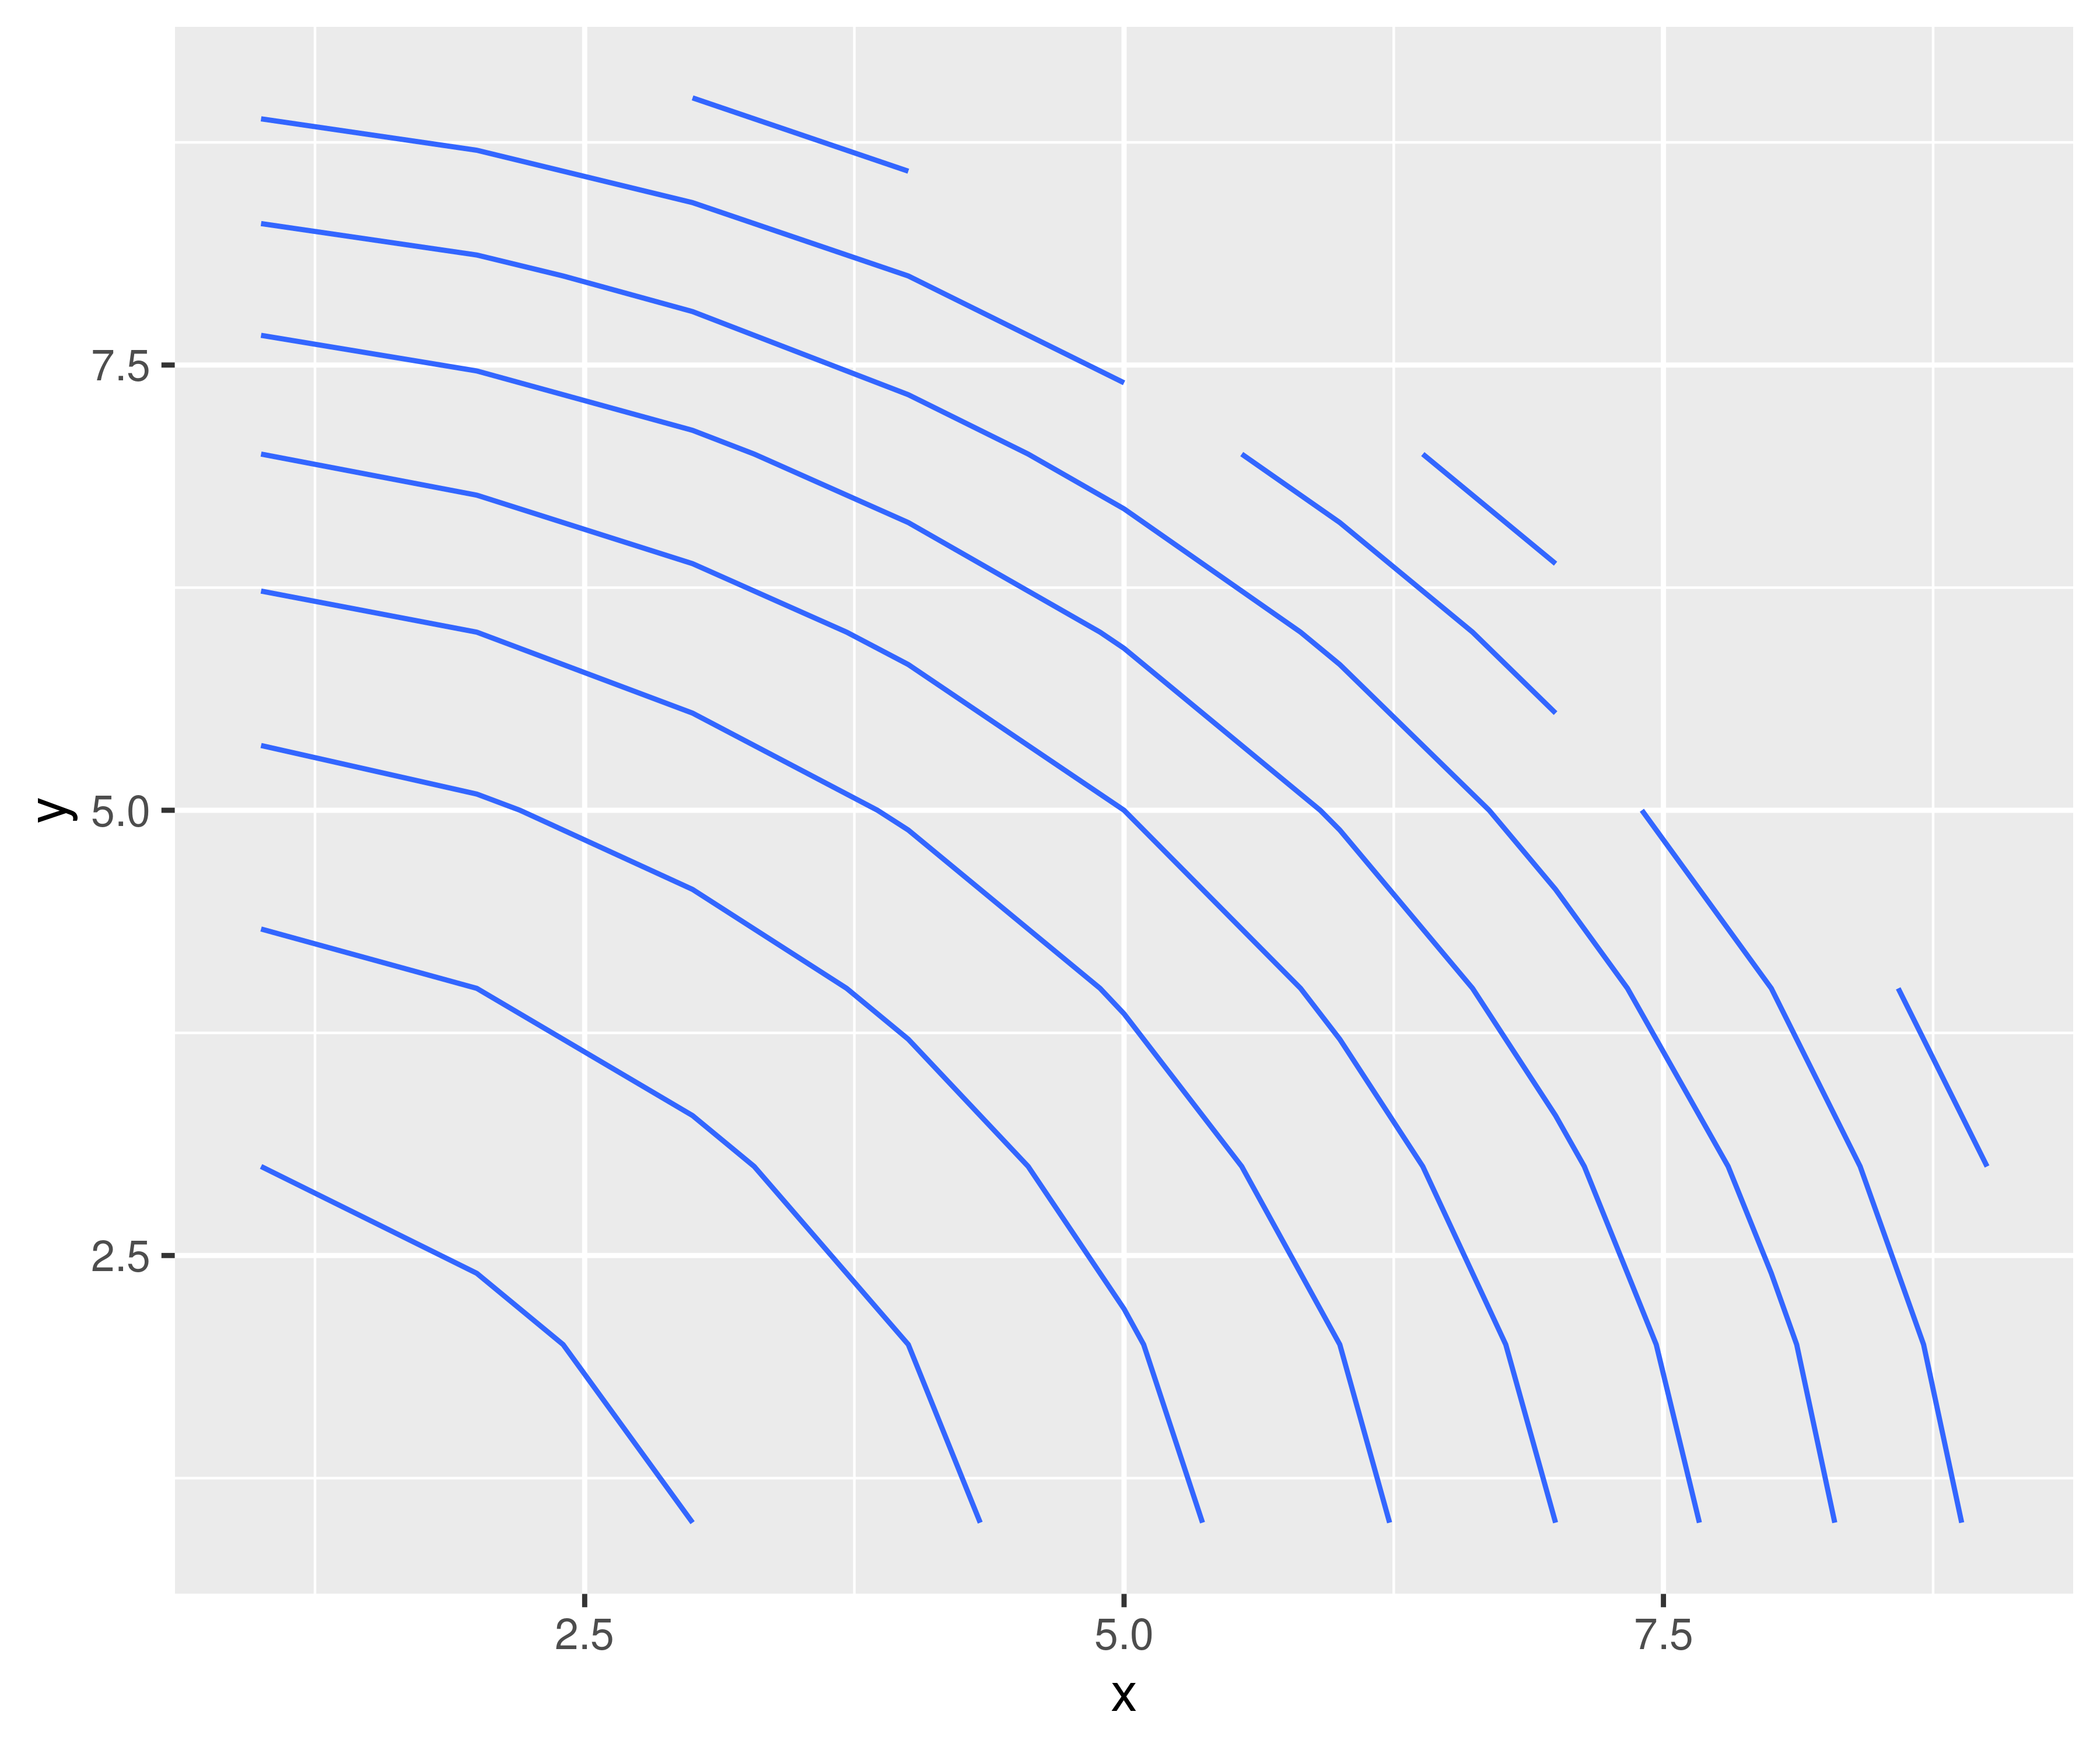
图 6.6: with 操作