12.24 瀑布图
瀑布图 waterfall 与上月相比,谁增谁减,用瀑布图分别表示占比和绝对数值。瀑布图 waterfall
balance <- data.frame(
  event = c(
    "Starting\nCash", "Sales", "Refunds",
    "Payouts", "Court\nLosses", "Court\nWins", "Contracts", "End\nCash"
  ),
  change = c(2000, 3400, -1100, -100, -6600, 3800, 1400, -2800)
)

balance$balance <- cumsum(c(0, balance$change[-nrow(balance)])) # 累计值
balance$time <- 1:nrow(balance)
balance$flow <- factor(sign(balance$change)) # 变化为正还是为负

ggplot(balance) +
  geom_hline(yintercept = 0, colour = "white", size = 2) +
  geom_rect(aes(
    xmin = time - 0.45, xmax = time + 0.45,
    ymin = balance, ymax = balance + change, fill = flow
  )) +
  geom_text(aes(
    x = time,
    y = pmin(balance, balance + change) - 50,
    label = scales::dollar(change)
  ),
  hjust = 0.5, vjust = 1, size = 3
  ) +
  scale_x_continuous(
    name = "",
    breaks = balance$time,
    labels = balance$event
  ) +
  scale_y_continuous(
    name = "Balance",
    labels = scales::dollar
  ) +
  scale_fill_brewer(palette = "Spectral") +
  theme_minimal()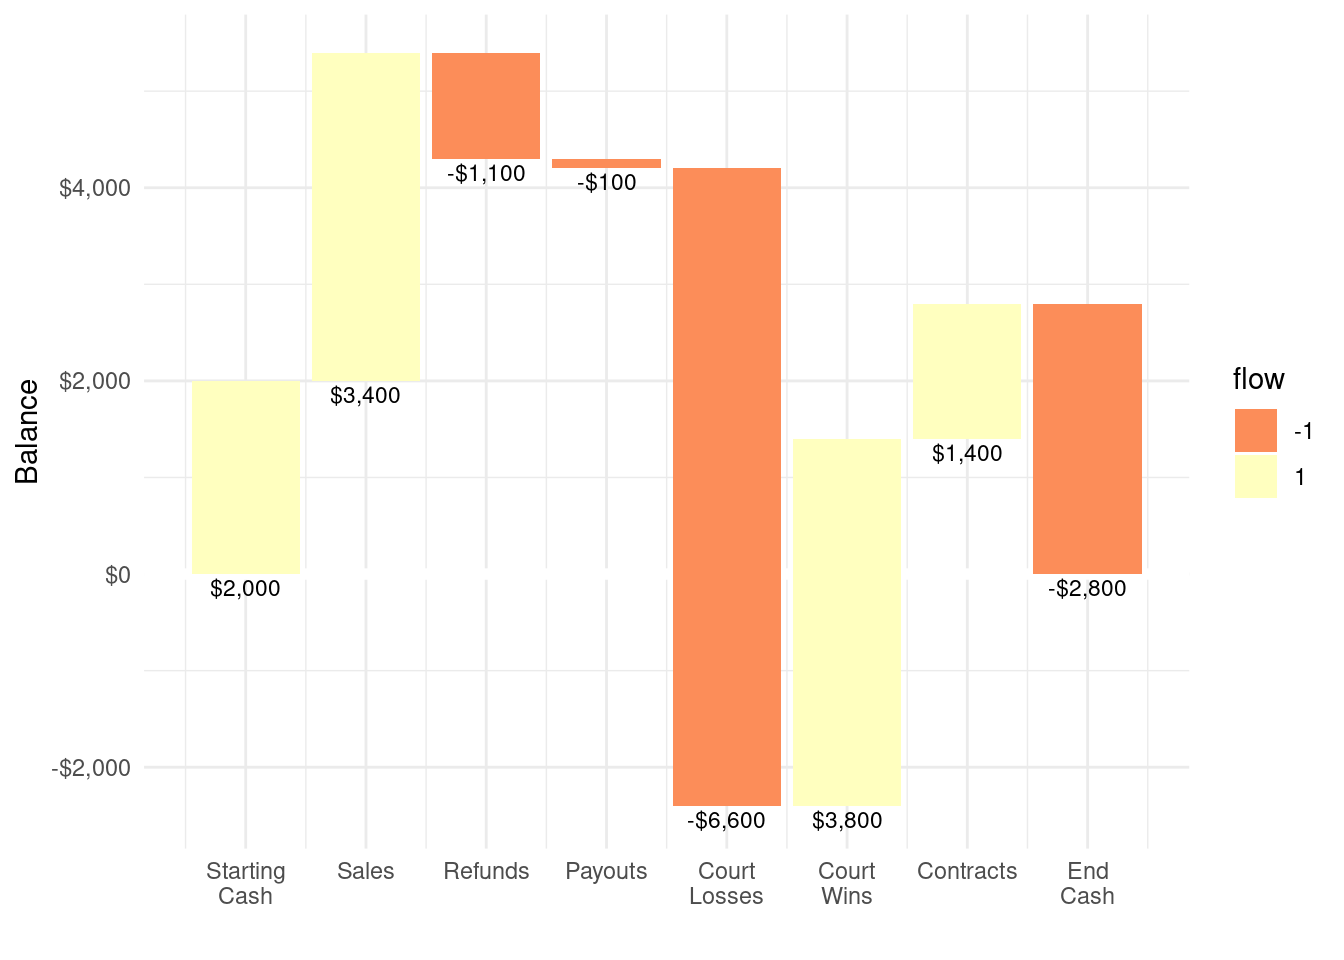
图 12.65: 瀑布图