12.26 时间线
# 交互动态图 https://github.com/shosaco/vistime
# 刘思喆 2018 数据科学的时间轴 https://bjt.name/2018/11/18/timeline.html
x <- read.table(
  textConnection("
The Future of Data Analysis,1962
Relational Database,1970
Data science(Peter Naur),1974
Two-Way Communication,1975
Exploratory Data Analysis,1977
Business Intelligence,1989
The First Database Report,1992
The World Wide Web Explodes,1995
Data Mining and Knowledge Discovery,1997
S(ACM Software System Award),1998
Statistical Modeling: The Two Cultures,2001
Hadoop,2006
Data scientist,2008
NOSQL,2009
Deep Learning,2015
"),
  sep = ","
)
names(x) <- c("Event", "EventDate")
x$EventDate <- as.Date(paste(x$EventDate, "/01/01", sep = ""))

library(timelineS)
timelineS(x,
  labels = paste(x[[1]], format(x[[2]], "%Y")),
  line.color = "blue", label.angle = 15
)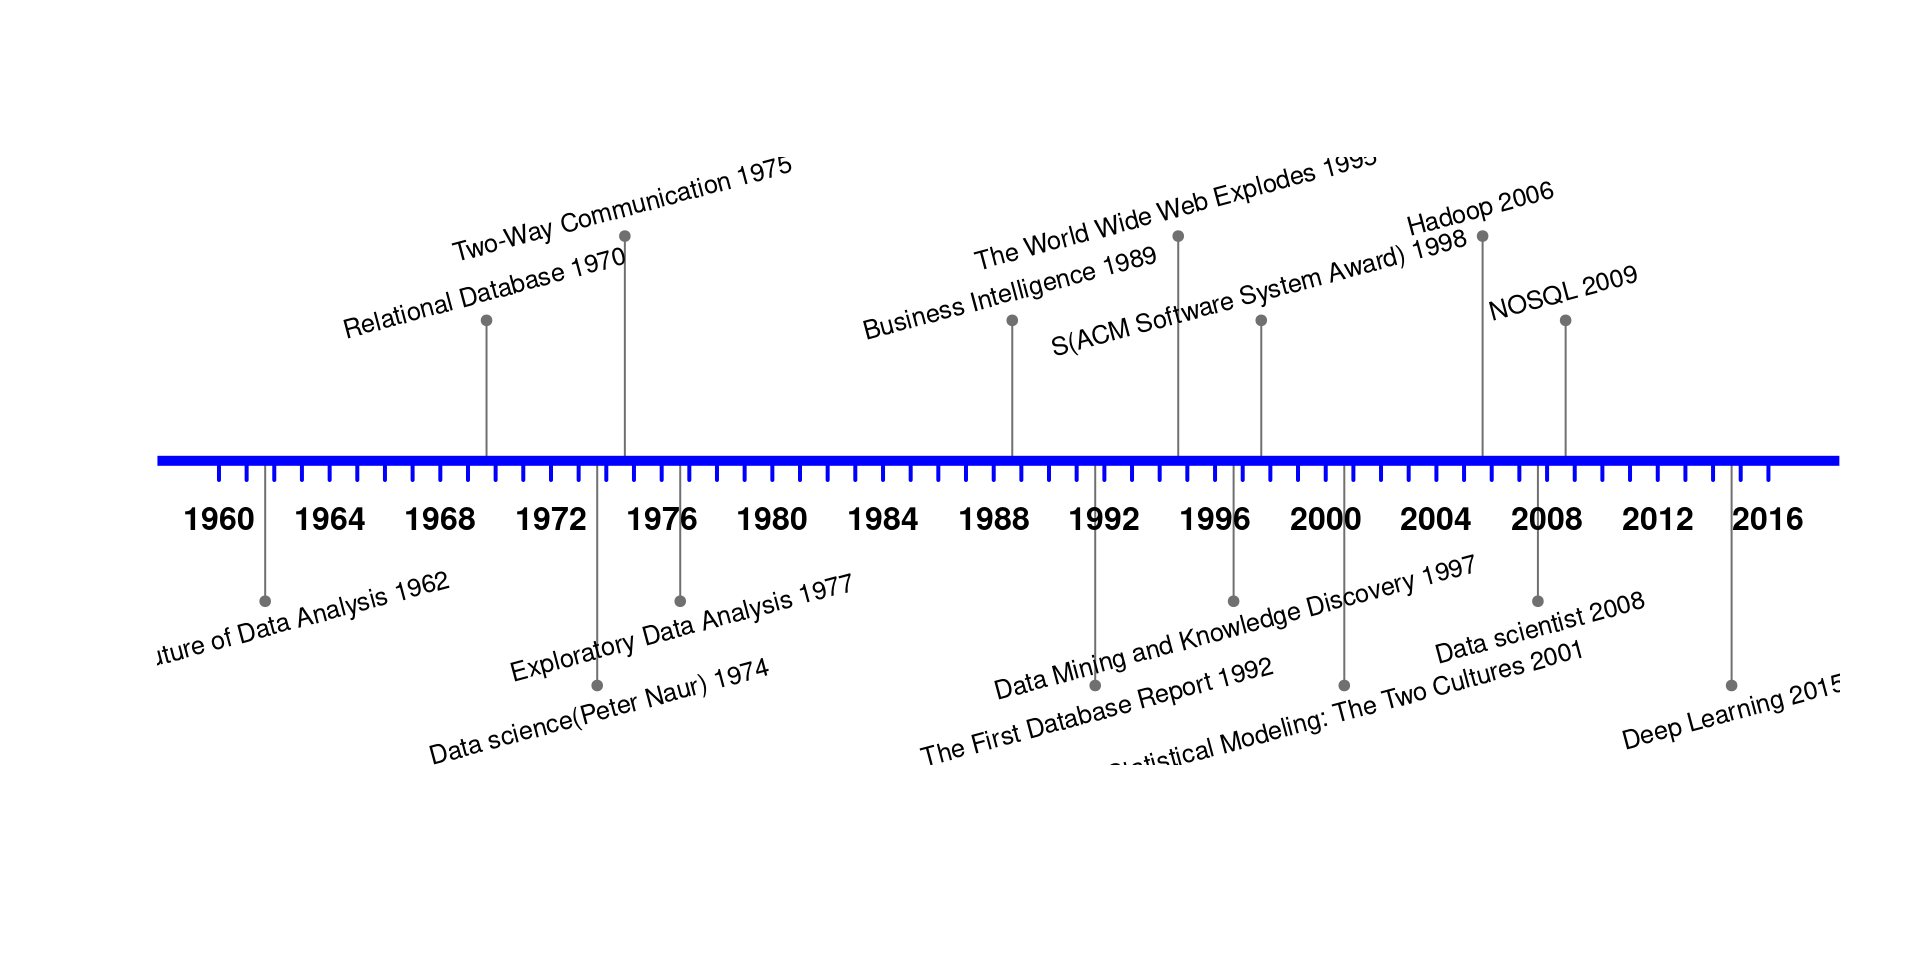
图 12.67: 数据科学的时间轴
library(timeline)
data(ww2, package = 'timeline')
timeline(ww2, ww2.events, event.spots=2, event.label='', event.above=FALSE)
# 适合放在动态幻灯片
# 美团风格的写轮眼
# 时间线
library(vistime)
# presidents and vice presidents
pres <- data.frame(
Position = rep(c("President", "Vice"), each = 3),
Name = c("Washington", rep(c("Adams", "Jefferson"), 2), "Burr"),
start = c("1789-03-29", "1797-02-03", "1801-02-03"),
end = c("1797-02-03", "1801-02-03", "1809-02-03"),
color = c("#cbb69d", "#603913", "#c69c6e")
)
hc_vistime(pres, col.event = "Position", col.group = "Name",
title = "Presidents of the USA")