12.20 拟合图
xx <- -9:9
yy <- sqrt(abs(xx))
plot(xx, yy,
  col = "red",
  xlab = expression(x),
  ylab = expression(sqrt(abs(x)))
)
lines(spline(xx, yy, n = 101, method = "fmm", ties = mean), col = "pink")

myspline <- function(formula, data, ...) {
  dat <- model.frame(formula, data)
  res <- splinefun(dat[[2]], dat[[1]])
  class(res) <- "myspline"
  res
}

predict.myspline <- function(object, newdata, ...) {
  object(newdata[[1]])
}

data.frame(x = -9:9) %>%
  transform(y = sqrt(abs(x))) %>%
  ggplot(aes(x = x, y = y)) +
  geom_point(color = "red", pch = 1, size = 2) +
  stat_smooth(method = myspline, formula = y~x, se = F, color = "pink") +
  labs(x = expression(x), y = expression(sqrt(abs(x)))) +
  theme_minimal()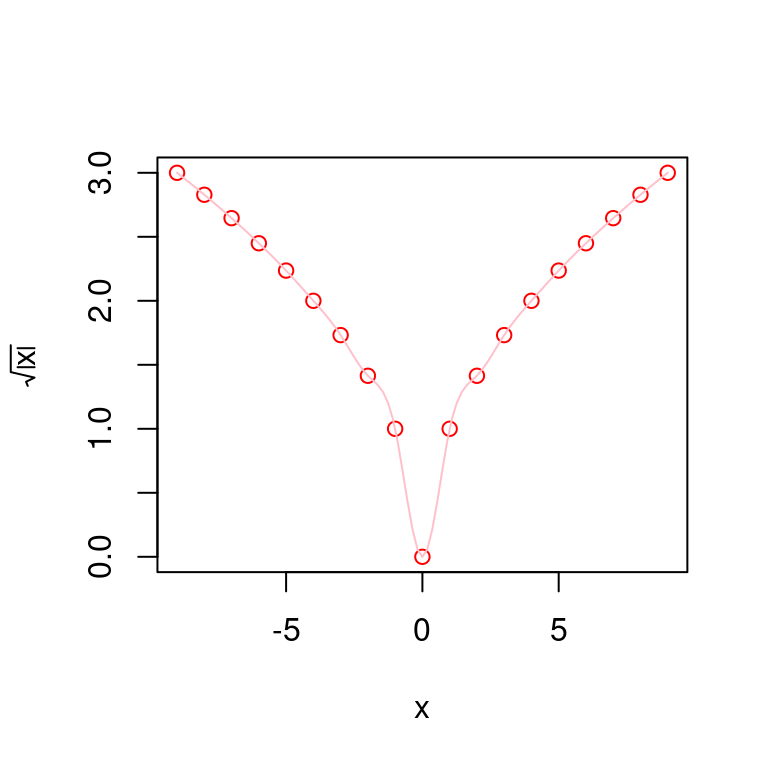
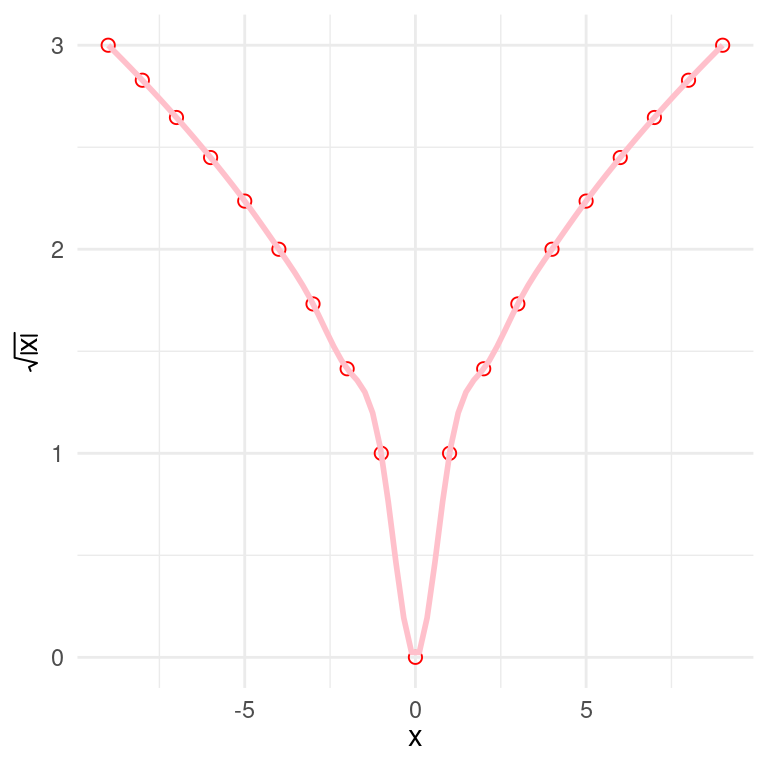
图 12.60: 自定义样条函数
下面以真实数据集 trees 为例,介绍 geom_smooth() 支持的拟合方法,比如 "lm" 线性回归和 "nls" 非线性回归
ggplot(trees, aes(x = log(Girth), y = log(Volume))) +
  geom_point() +
  geom_smooth(method = "lm", formula = y ~ x, se = FALSE)

ggplot(trees, aes(x = Girth, y = Volume)) +
  geom_point() +
  geom_smooth(
    method = "nls", formula = y ~ a * x^2 + b, se = F,
    method.args = list(start = list(a = 5, b = -36))
  )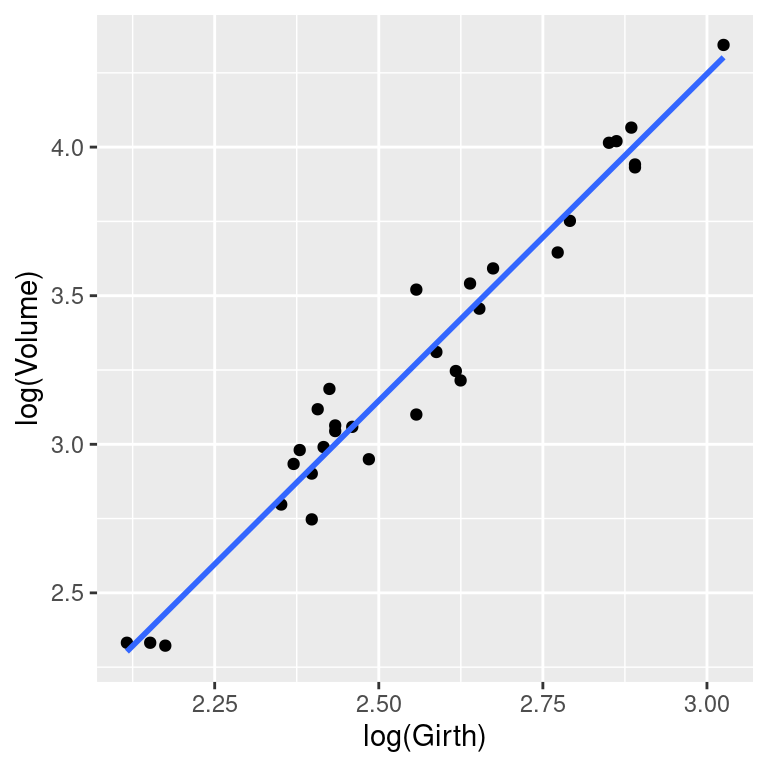
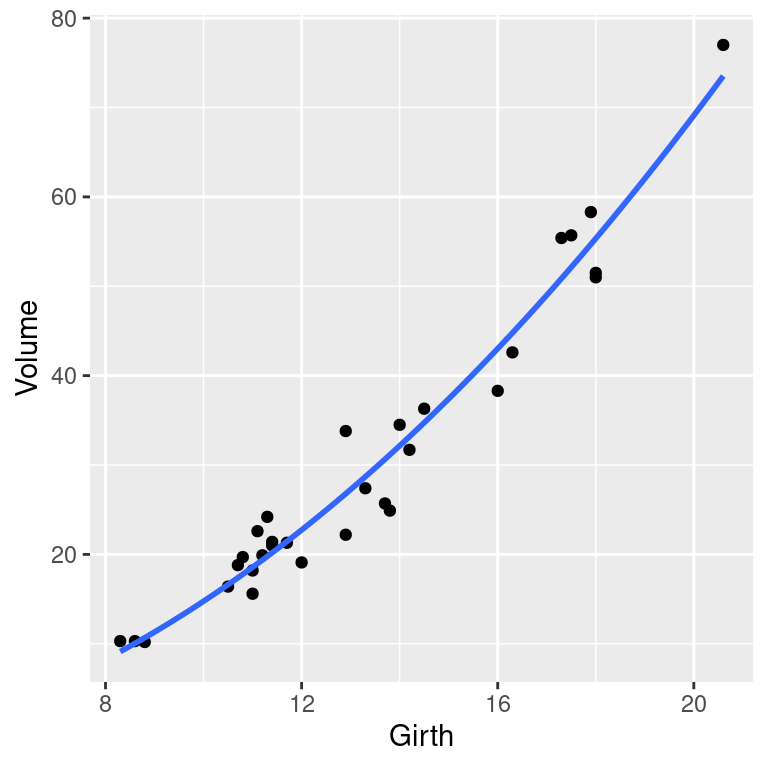
图 12.61: 平滑方法