12.23 留存图
cohort <- data.frame(
  cohort = rep(1:5, times = 5:1),
  week = c(1:5, 1:4, 1:3, 1:2, 1),
  value = c(
    75, 73, 54, 23, 3,
    98, 94, 70, 25,
    52, 5, 3,
    44, 15,
    88
  )
)

ggplot(cohort, aes(x = week, y = cohort, fill = value)) +
  geom_tile(color = "white") +
  geom_text(aes(label = value), color = "white") +
  scale_y_reverse() +
  scale_fill_binned(type = "viridis")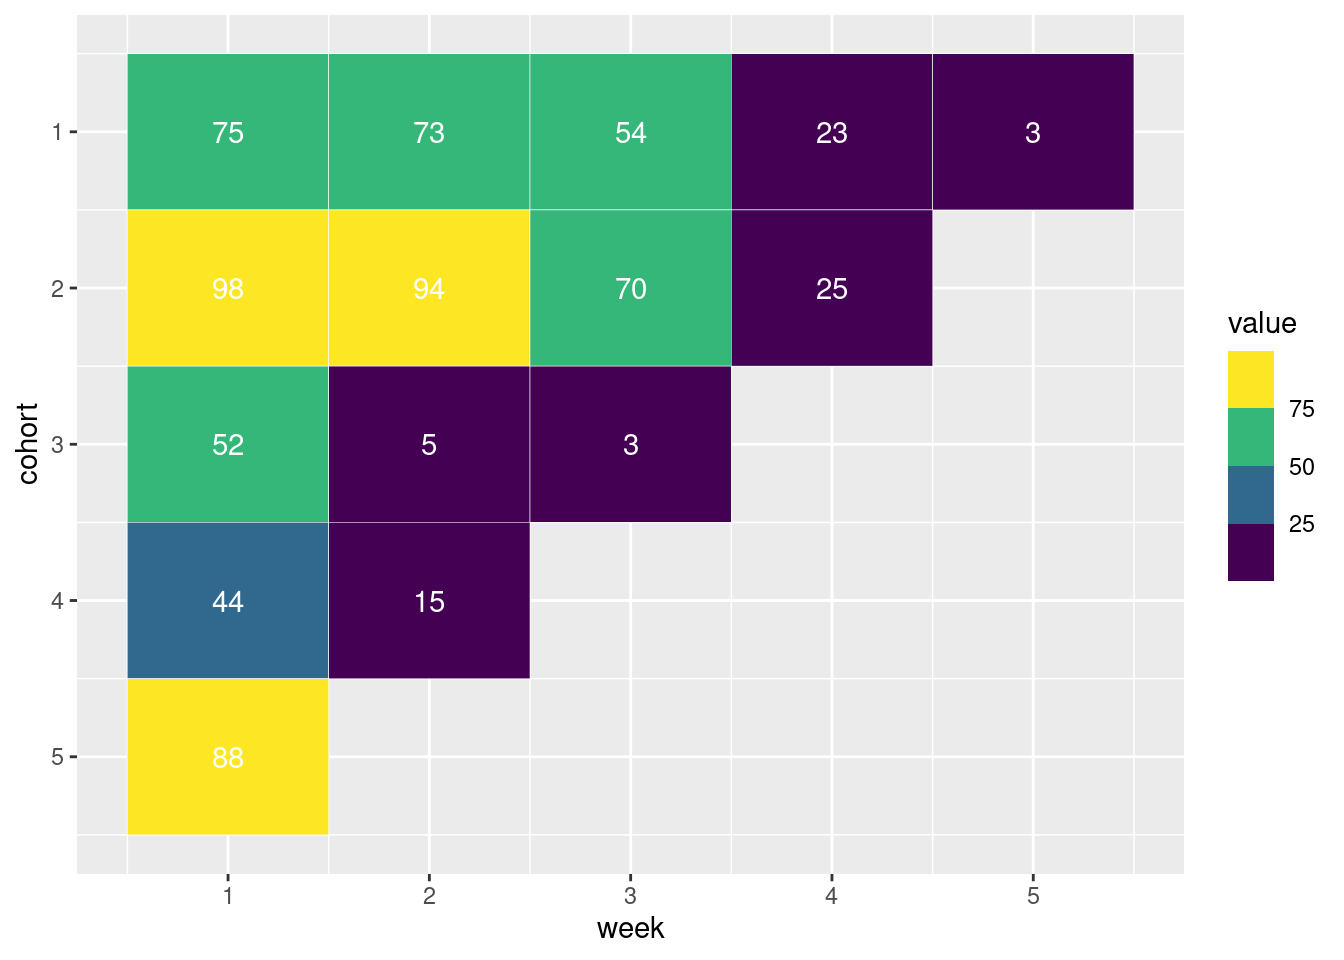
留存是 Cohort 分析 中的一种情况,还有转化等,首先 定义你的问题,确定度量问题的指标,确定和问题相关的 Cohort (比如时间、空间和用户属性等关键的影响因素),然后数据处理、可视化获得 Cohort 分析结果,最后在实际决策和行动中检验分析结论。