12.34 动态图
av 包基于 FFmpeg 将静态图片合成视频,而 gifski 包基于 gifski 将静态图片合成 GIF 动画,animation 包 [23] 将 Base R 绘制的图形转化为动画或视频,mapmate 制作地图相关的三维可视化图形,gganimate 包支持将 ggplot2 生成的图形,magick 可以将一系列静态图形合成动态图形,借助 gifski 包转化为动态图片或视频。推荐读者从 gganimate 案例合集 开始制作动态图形。 rgl 可以制作真三维动态图形,支持缩放、拖拽、旋转等操作, rayshader 还支持转化 ggplot2 对象为 3D 图形。
p <- ggplot(
  data = Indometh,
  aes(x = time, y = conc, color = Subject)
) +
  geom_point() +
  geom_line() +
  theme_minimal() +
  labs(
    x = "time (hr)",
    y = "plasma concentrations of indometacin (mcg/ml)"
  )
p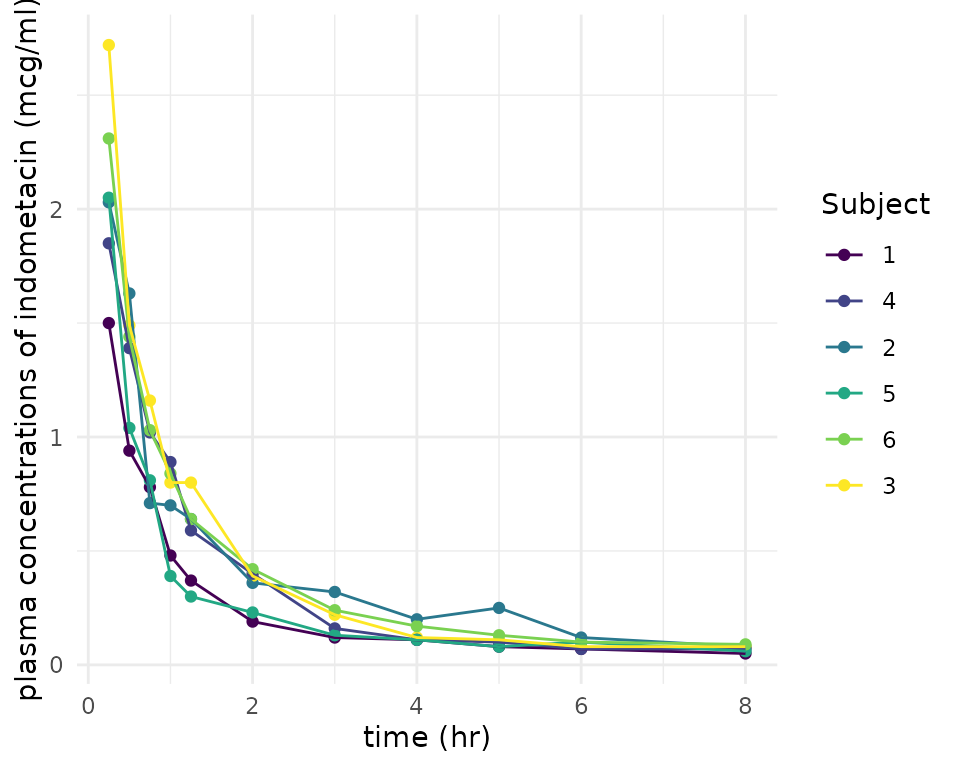
图 12.72: 药物在人体中的代谢情况
library(gganimate)
p +
  transition_reveal(time)
动态图形制作的原理,简单来说,就是将一帧帧静态图形以较快的速度播放,人眼形成视觉残留,以为是连续的画面,相比于 animation, gganimate 借助 tweenr 包添加了过渡效果,动态图形显得非常自然。下面以 cup 函数38为例
\[f(x;\theta,\phi) = \theta x\log(x)-\frac{1}{\phi}\mathit{e}^{-\phi^4(x-\frac{1}{\mathit{e}})^4}, \quad \theta \in (2,3), \phi \in (30,50), x \in (0,1)\]
函数图像随着 \(\theta\) 和 \(\phi\) 的变化情况见图 12.73。
library(tweenr)
cup_curve <- function(n = 100, theta = 3, phi = 30, cup = "A") {
  data.frame(x = seq(0.00001, 1, length.out = n), cup = cup) %>%
    transform(y = theta * x * log(x, base = 10)
              - 1 / phi * exp(-(phi * x - phi / exp(1))^4))
}
mapply(
  FUN = cup_curve, theta = c(E = 3, D = 2.8, C = 2.5, B = 2.2, A = 2),
  phi = c(30, 33, 36, 40, 50), cup = c("E", "D", "C", "B", "A"),
  MoreArgs = list(n = 50), SIMPLIFY = FALSE, USE.NAMES = TRUE
) %>%
  tween_states(
    data = .,
    tweenlength = 2, statelength = 1,
    ease = rep("cubic-in-out", 4), nframes = 100
  ) %>%
  ggplot(data = ., aes(x, y, color = cup, frame = .frame)) +
  geom_path() +
  coord_flip() +
  theme_void()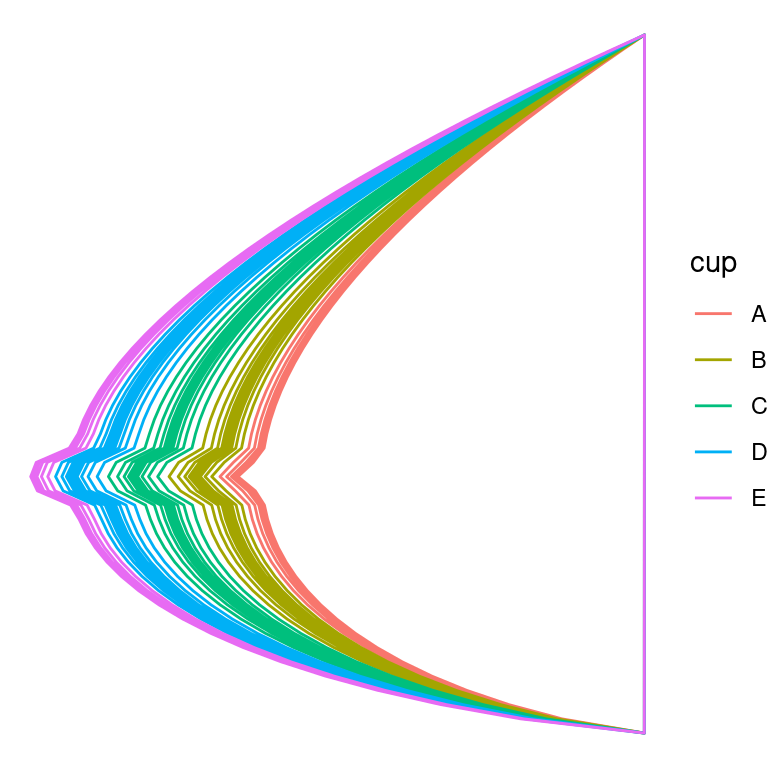
图 12.73: 添加过渡效果
参考文献
[23]
Y. Xie, “animation: An R package for creating animations and demonstrating statistical methods,” Journal of Statistical Software, vol. 53, no. 1, pp. 1–27, 2013,Available: http://www.jstatsoft.org/v53/i01/