12.13 玫瑰图
南丁格尔风玫瑰图36 可以作为堆积条形图,分组条形图
ggplot(diamonds, aes(x = color, fill = clarity)) +
  geom_bar()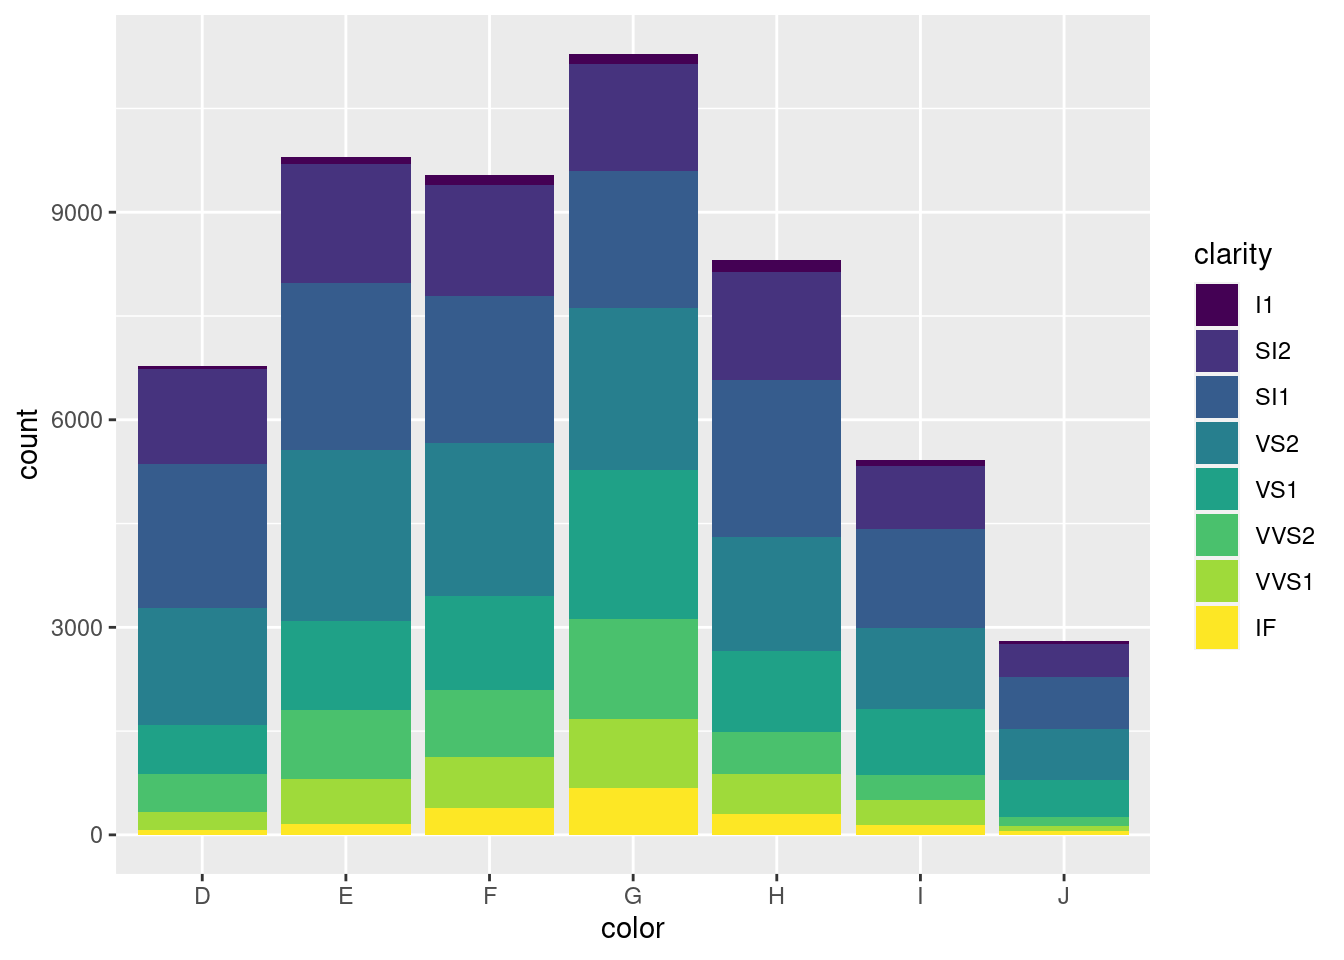
图 12.50: 堆积条形图转风玫瑰图
ggplot(diamonds, aes(x = color, fill = clarity)) +
  geom_bar() +
  coord_polar()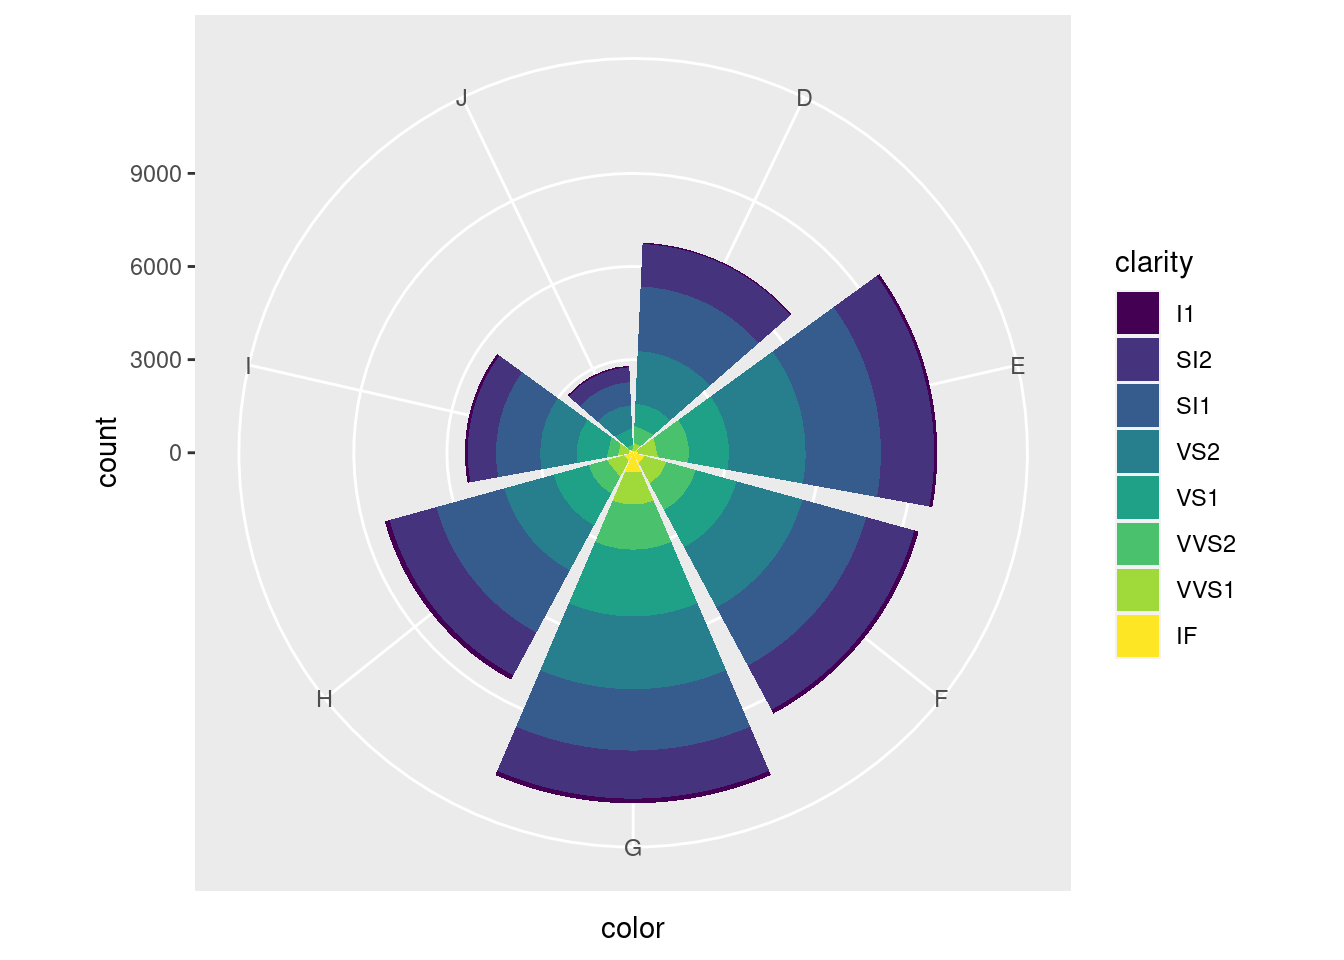
图 12.51: 堆积条形图转风玫瑰图
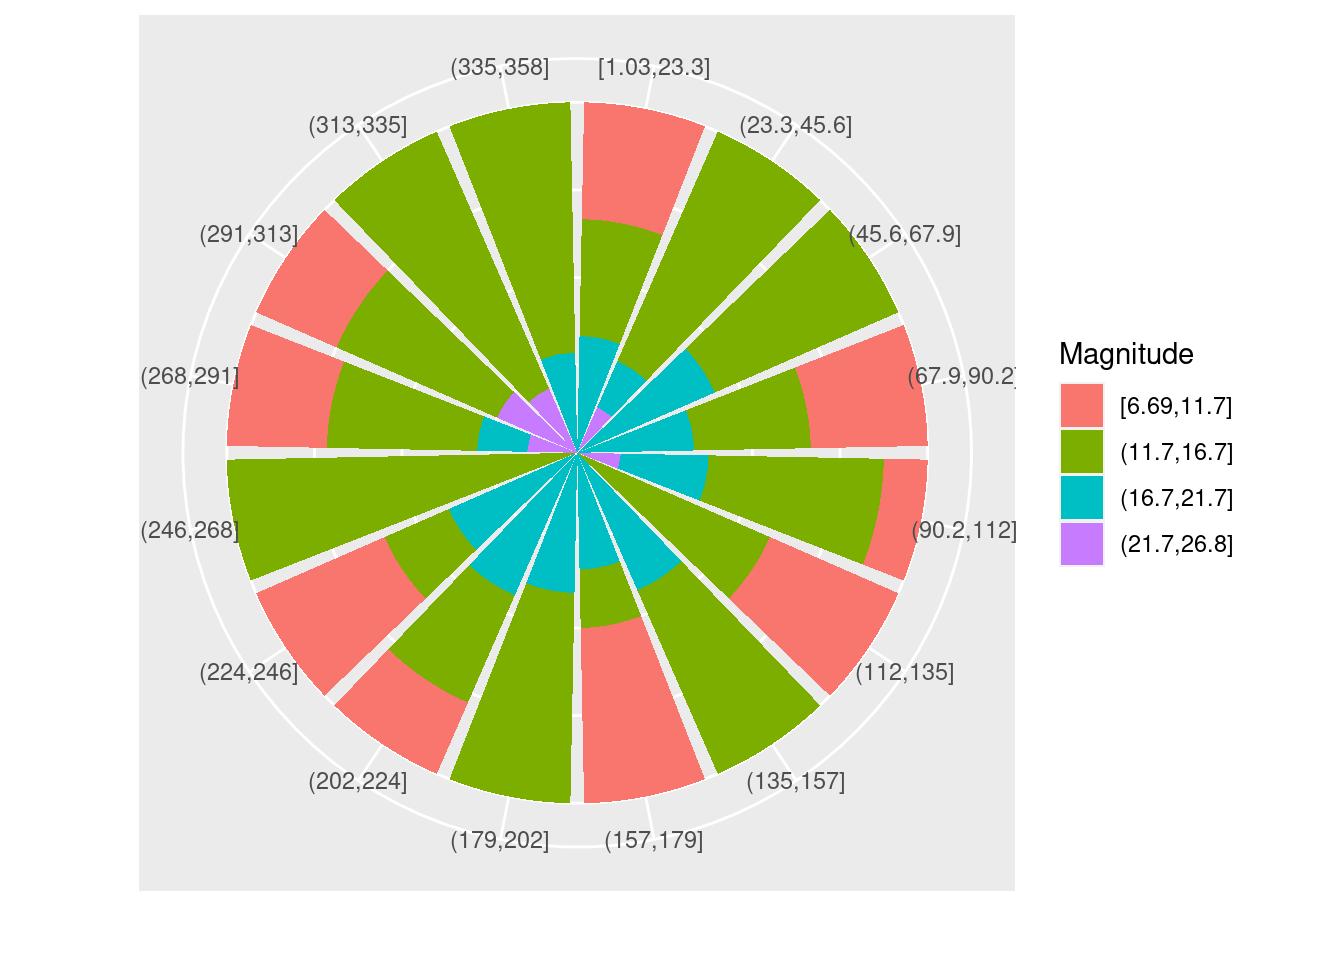
# 风玫瑰图 http://blog.csdn.net/Bone_ACE/article/details/47624987
set.seed(2018)
# 随机生成100次风向,并汇集到16个区间内
direction <- cut_interval(runif(100, 0, 360), n = 16)
# 随机生成100次风速,并划分成4种强度
mag <- cut_interval(rgamma(100, 15), 4)
dat <- data.frame(direction = direction, mag = mag)
# 将风向映射到X轴,频数映射到Y轴,风速大小映射到填充色,生成条形图后再转为极坐标形式即可
p <- ggplot(dat, aes(x = direction, y = ..count.., fill = mag))
p + geom_bar(colour = "white") +
  coord_polar() +
  theme(axis.ticks = element_blank(), axis.text.y = element_blank()) +
  labs(x = "", y = "", fill = "Magnitude")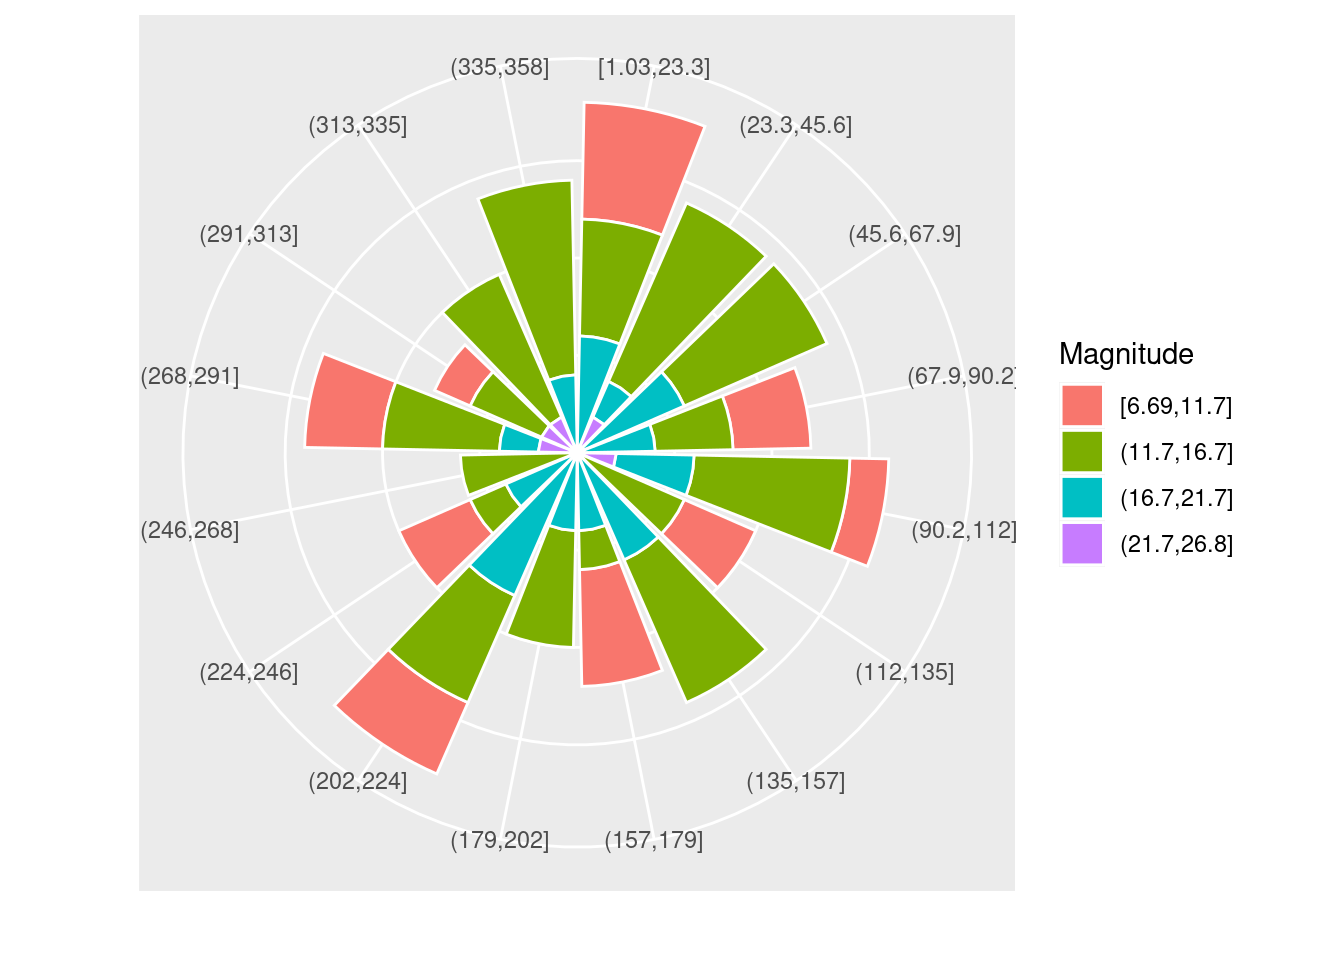
图 12.52: 风玫瑰图
p + geom_bar(position = "fill") +
  coord_polar() +
  theme(axis.ticks = element_blank(), axis.text.y = element_blank()) +
  labs(x = "", y = "", fill = "Magnitude")