12.11 抖动图
抖动图适合数据量比较小的情况
ggplot(mpg, aes(x = class, y = hwy, color = class)) + geom_jitter()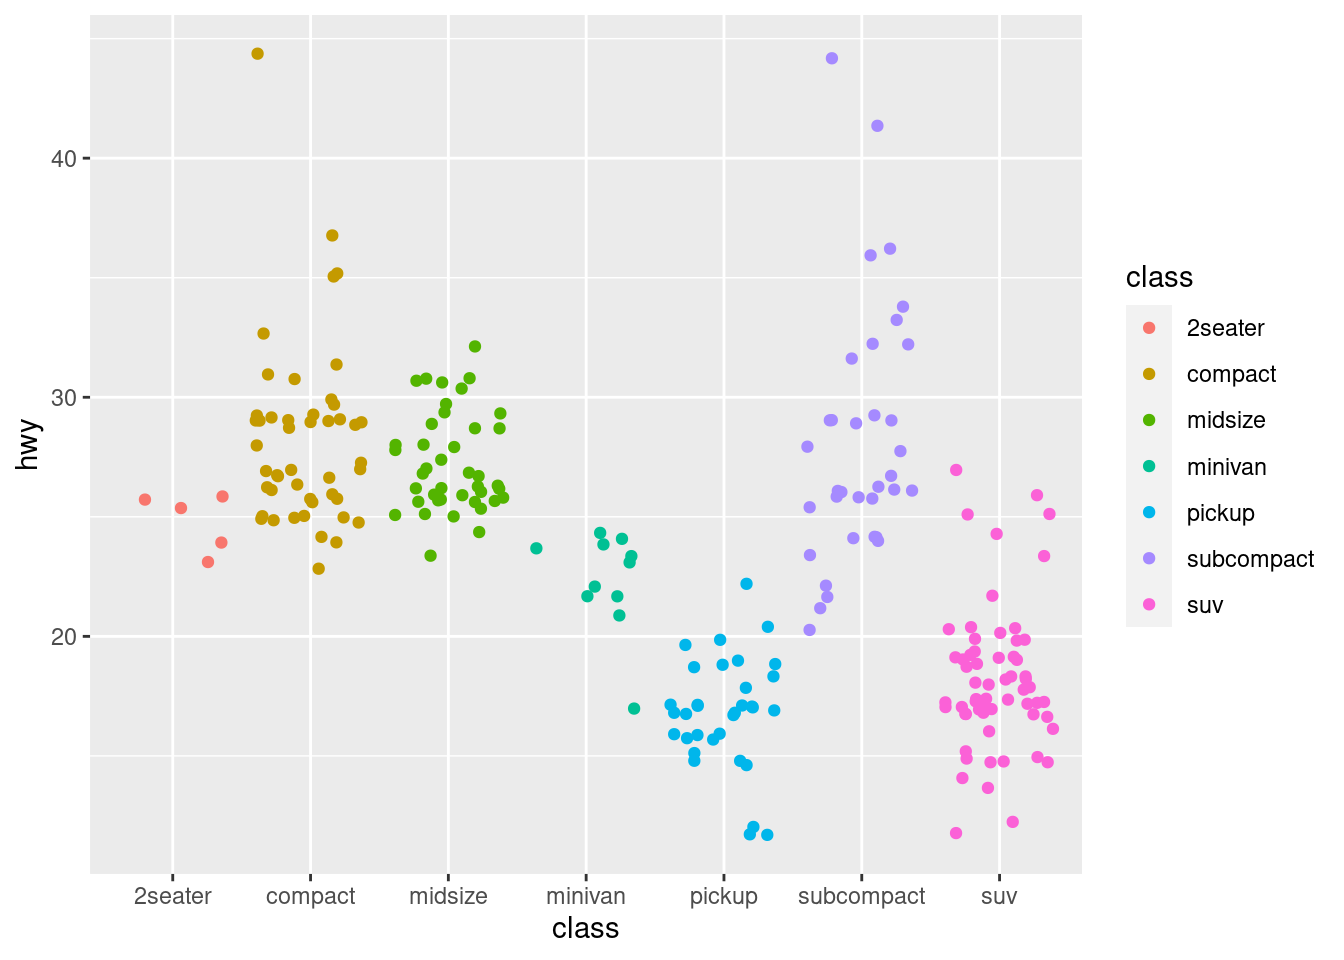
抖不抖,还是抖一下
ggplot(iris, aes(x = Species, y = Sepal.Length)) +
  geom_point(aes(fill = Species), size = 5, shape = 21, colour = "grey20") +
  # geom_boxplot(outlier.colour = NA, fill = NA, colour = "grey20") +
  labs(title = "Not Jittered")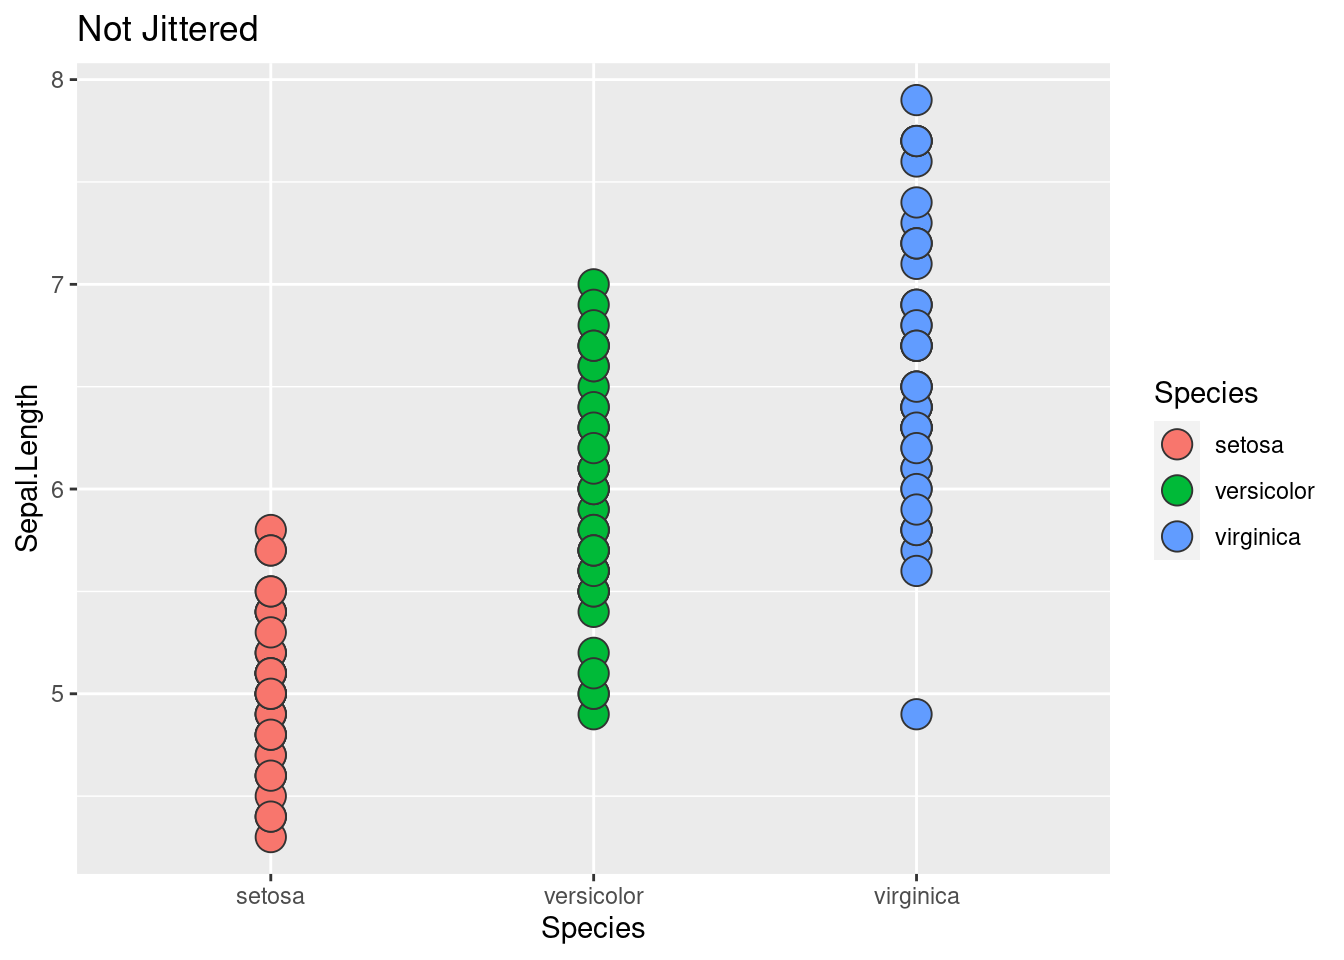
ggplot(iris, aes(x = Species, y = Sepal.Length)) +
  geom_point(aes(fill = Species),
    size = 5, shape = 21, colour = "grey20",
    position = position_jitter(width = 0.2, height = 0.1)
  ) +
  # geom_boxplot(outlier.colour = NA, fill = NA, colour = "grey20") +
  labs(title = "Jittered")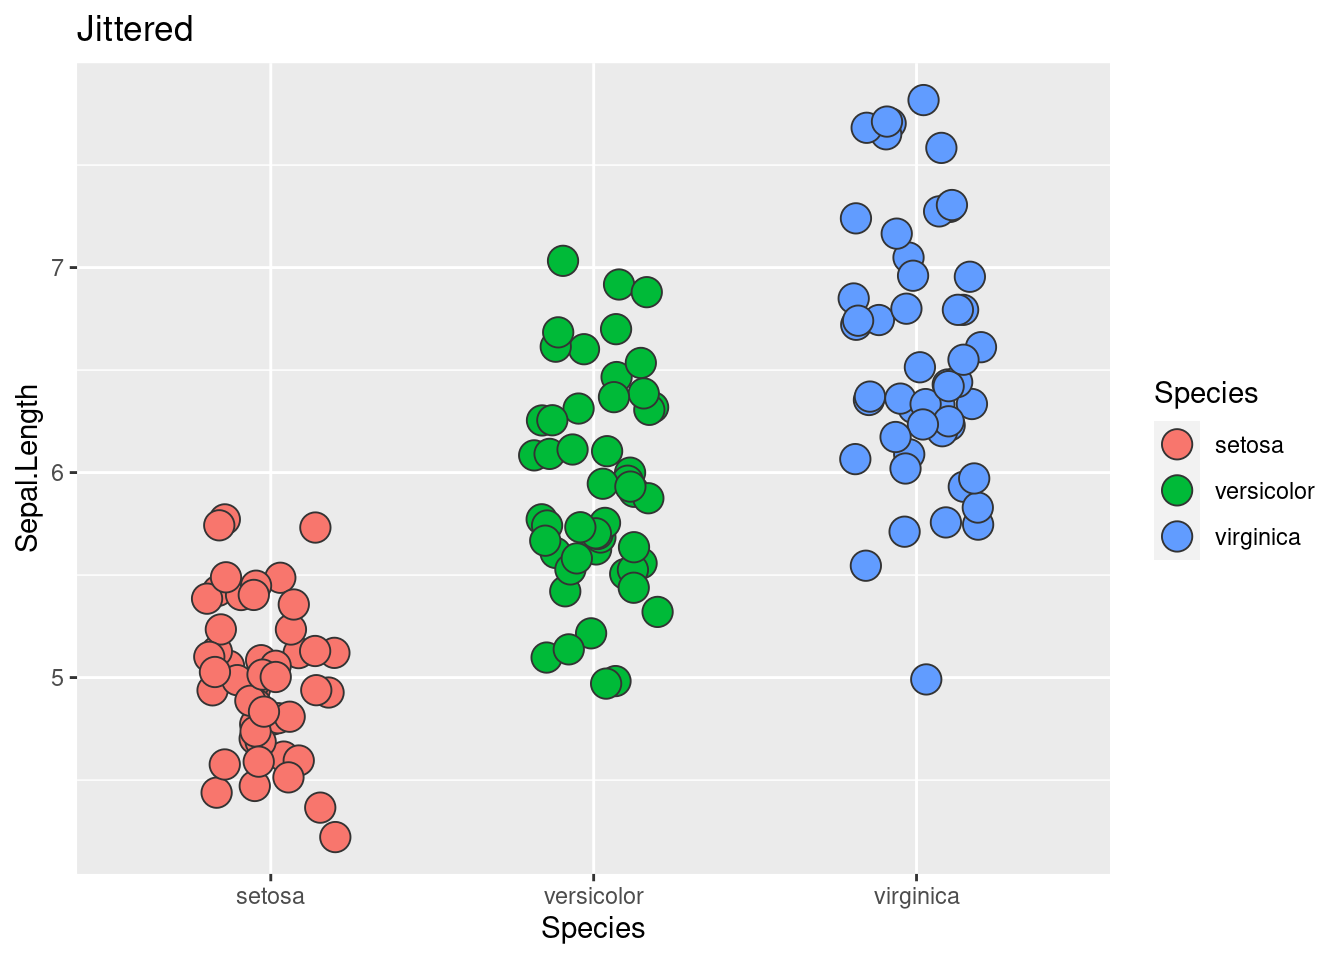
在数据量比较大的时候,可以用箱线图、密度图、提琴图
ggplot(sub_diamonds, aes(x = cut, y = price)) + geom_jitter()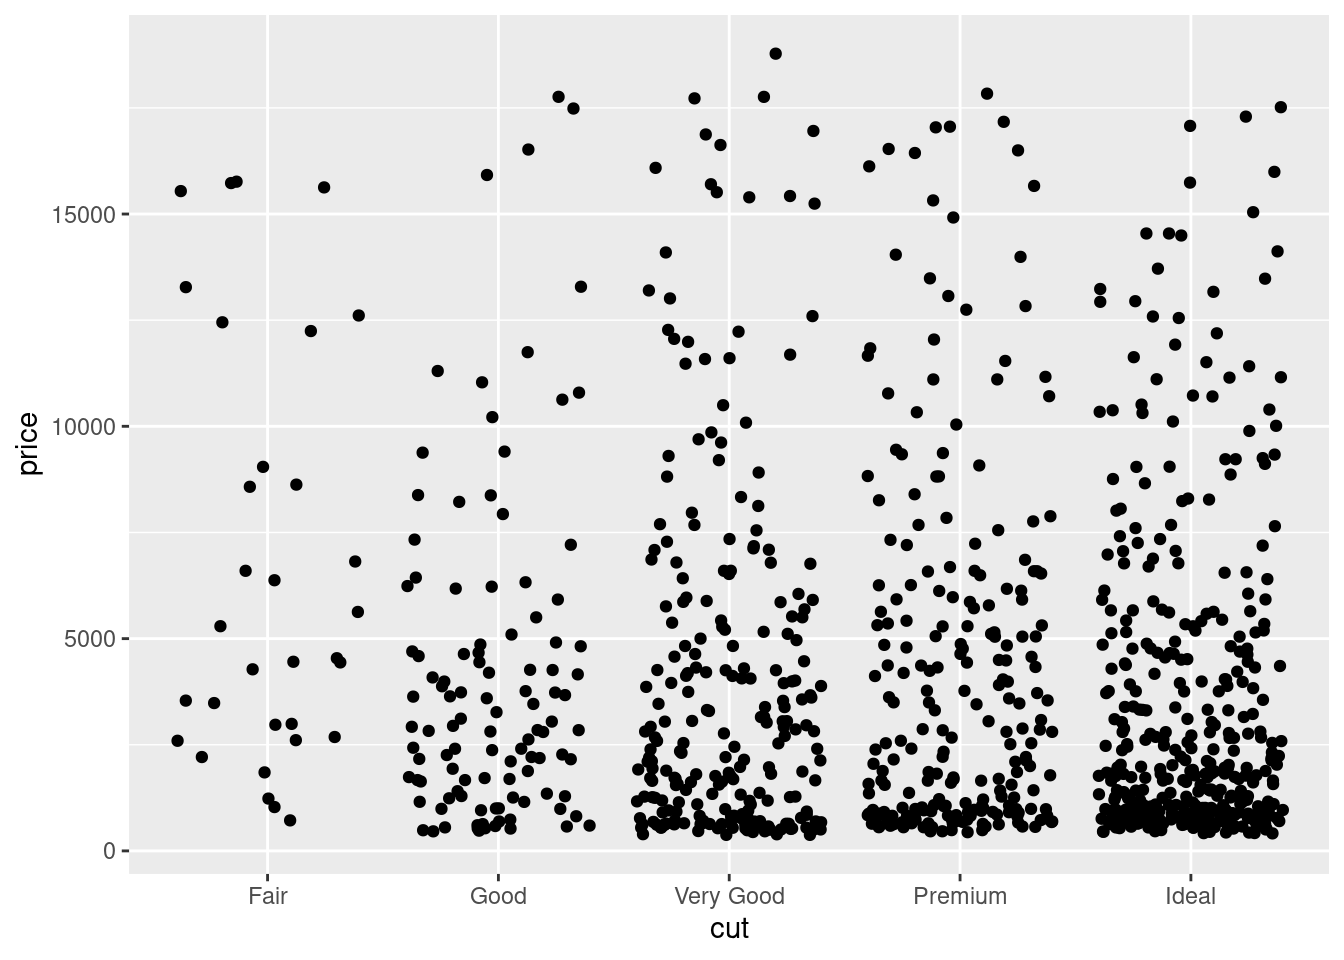
图 10.27: 抖动图的反例
上色和分面都不好使的抖动图,因为区分度变小
ggplot(sub_diamonds, aes(x = color, y = price, color = color)) +
  geom_jitter() +
  facet_grid(clarity ~ cut)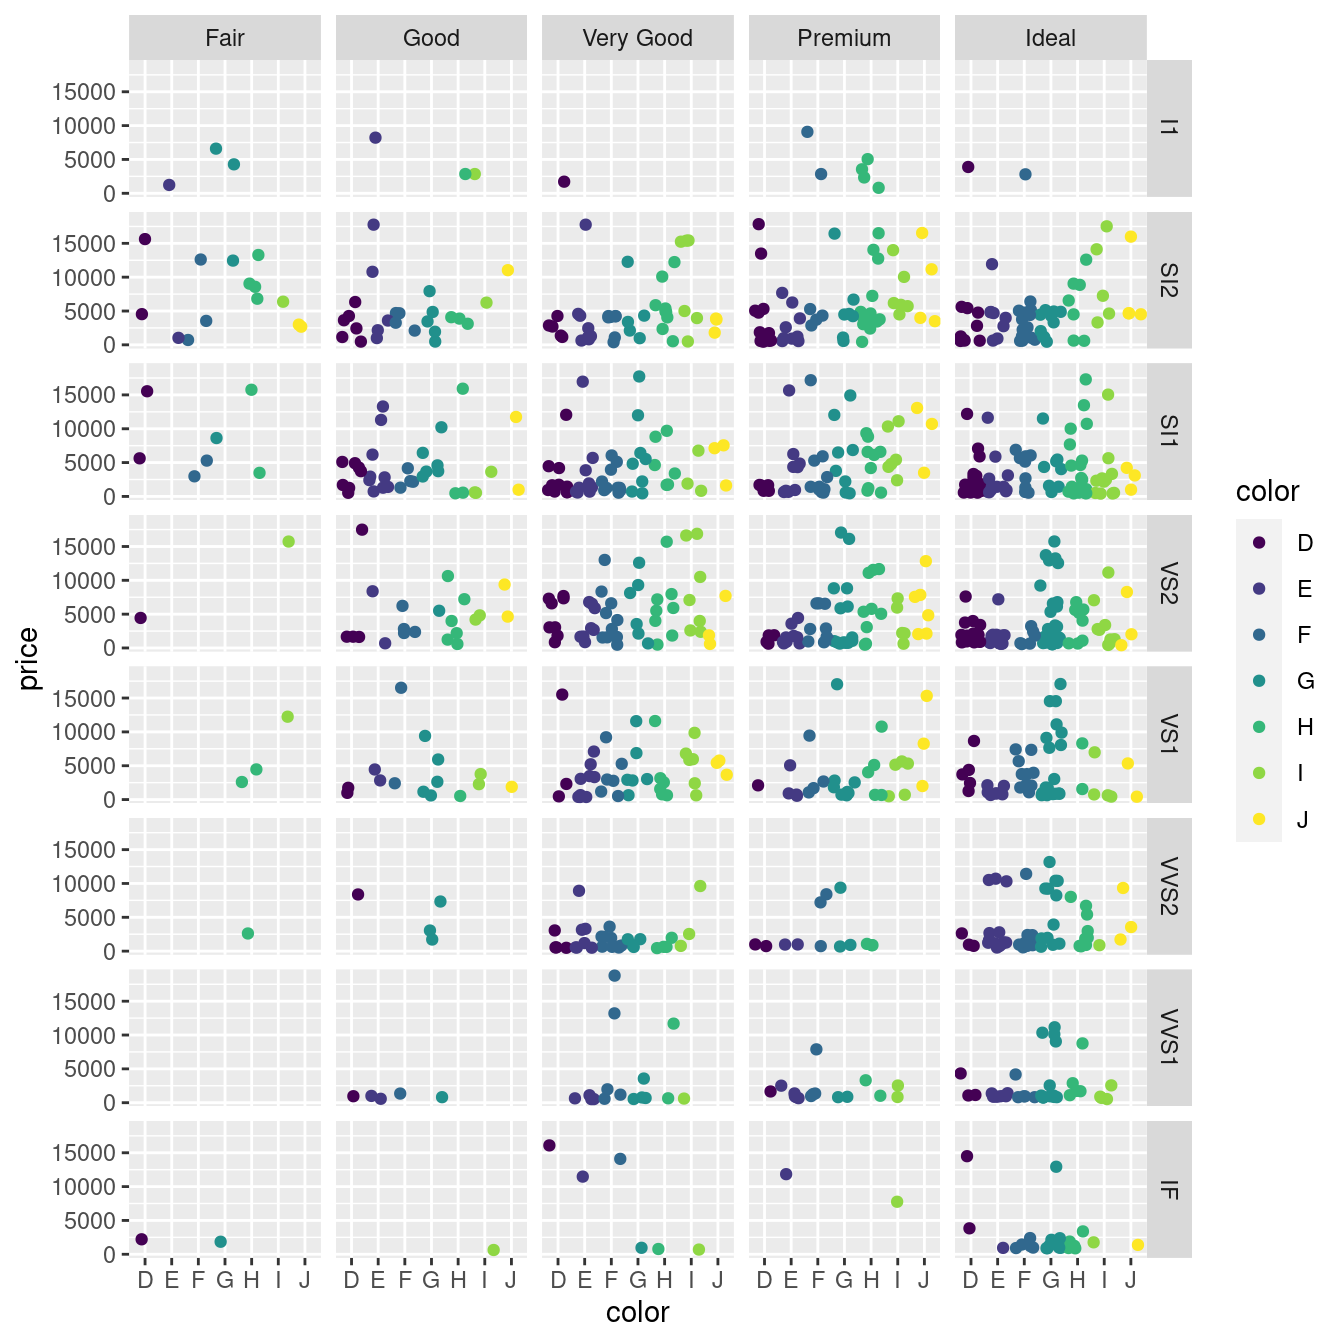
图 10.29: 根据钻石颜色上色
箱线图此时不宜分的过细
ggplot(diamonds, aes(x = color, y = price, color = color)) +
  geom_boxplot() +
  facet_grid(cut ~ clarity)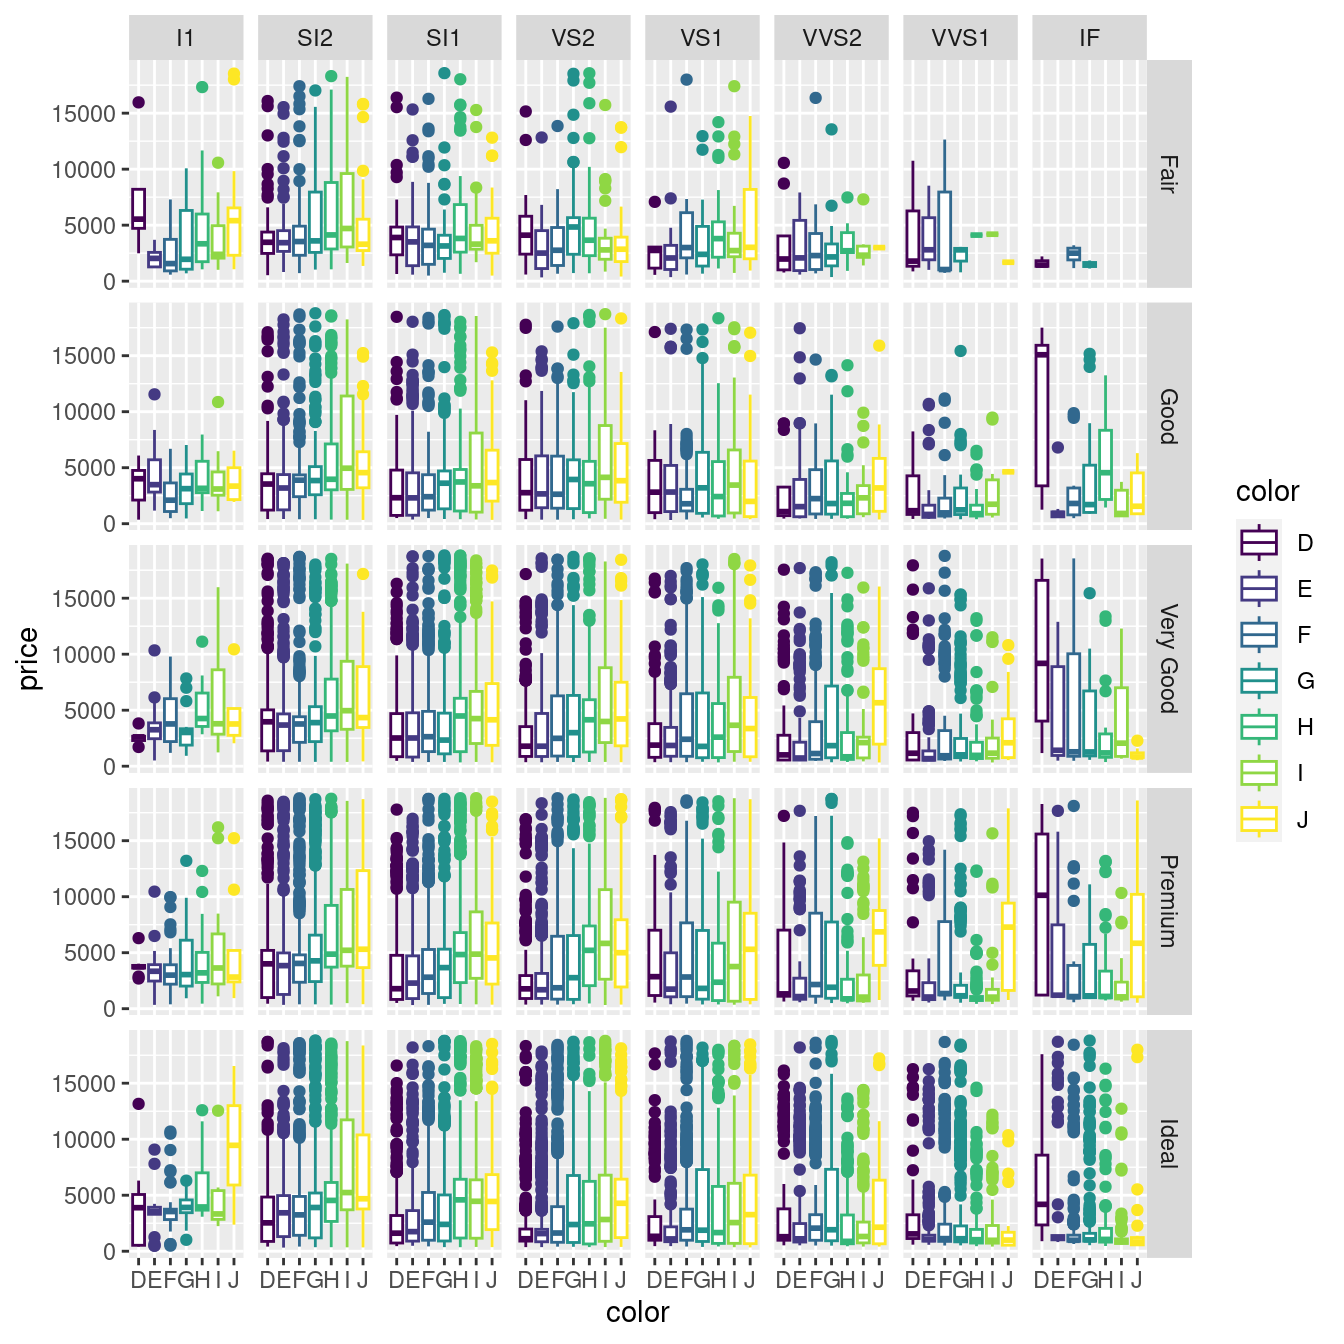
图 12.46: 箱线图
所以这样更好,先按纯净度分面,再对比不同的颜色,钻石价格的差异
ggplot(diamonds, aes(x = color, y = price, color = color)) +
  geom_boxplot() +
  facet_grid(~clarity)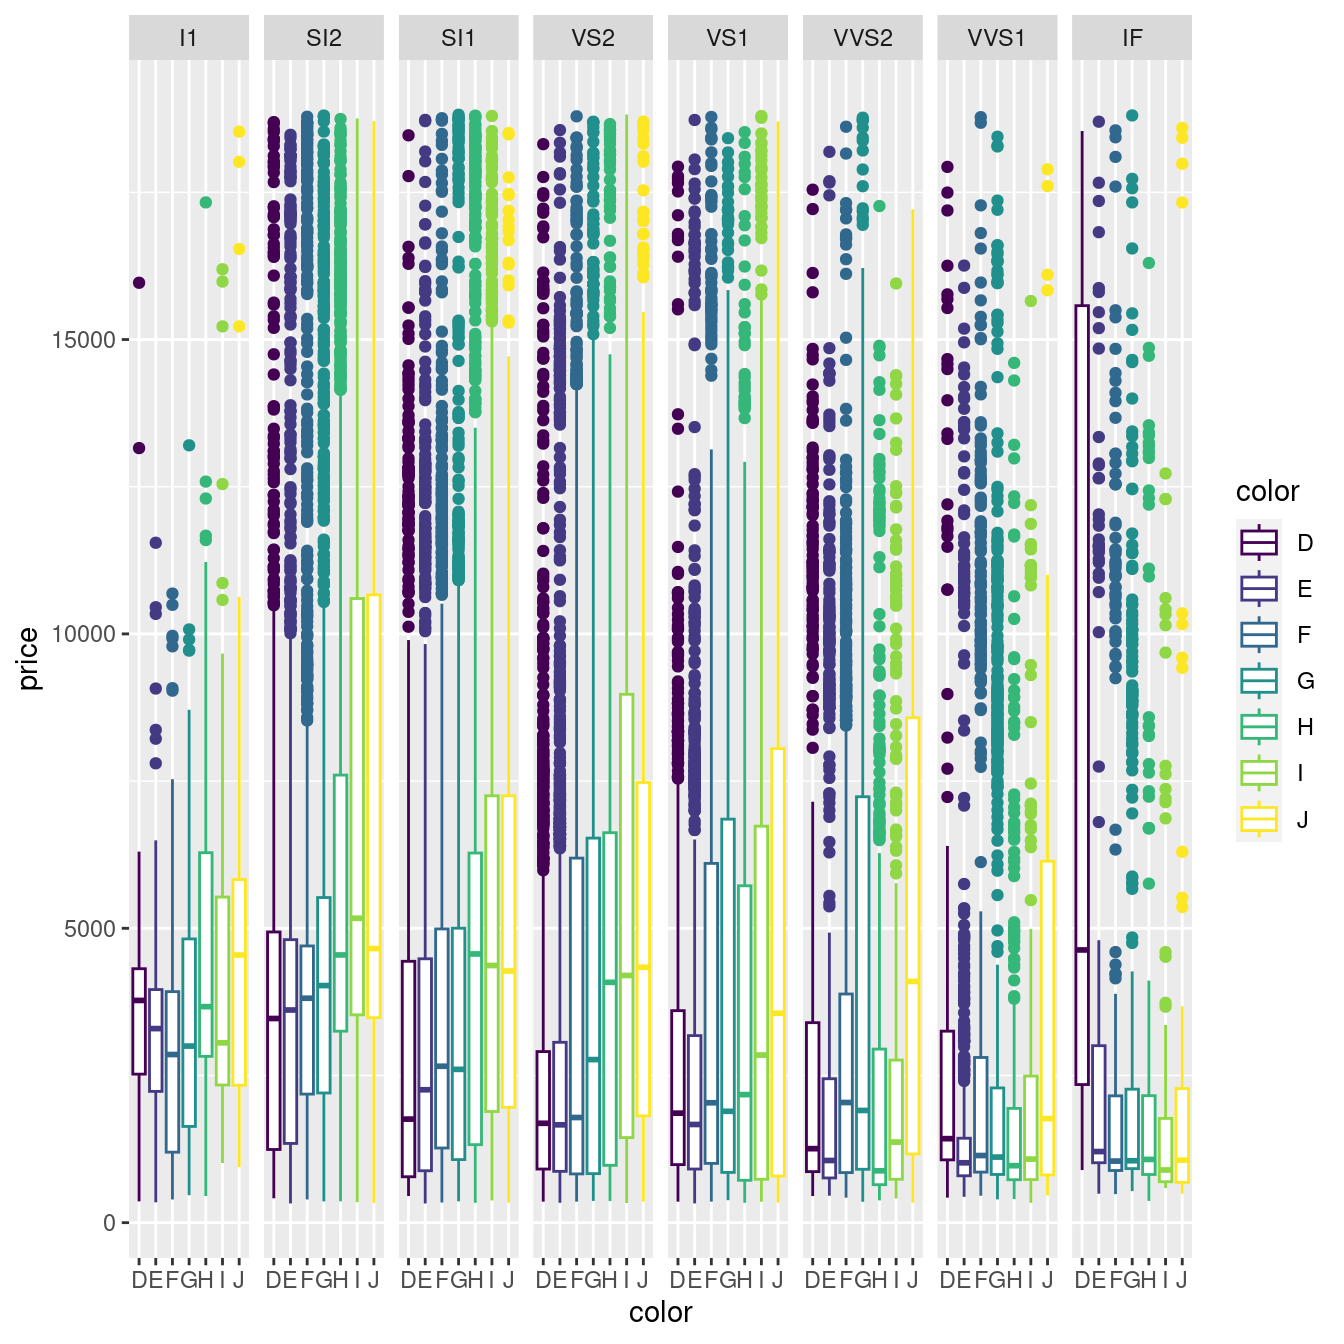
图 12.47: 钻石按纯净度分面
最好只比较一个维度,不同颜色钻石的价格对比
ggplot(diamonds, aes(x = color, y = price, color = color)) +
  geom_boxplot()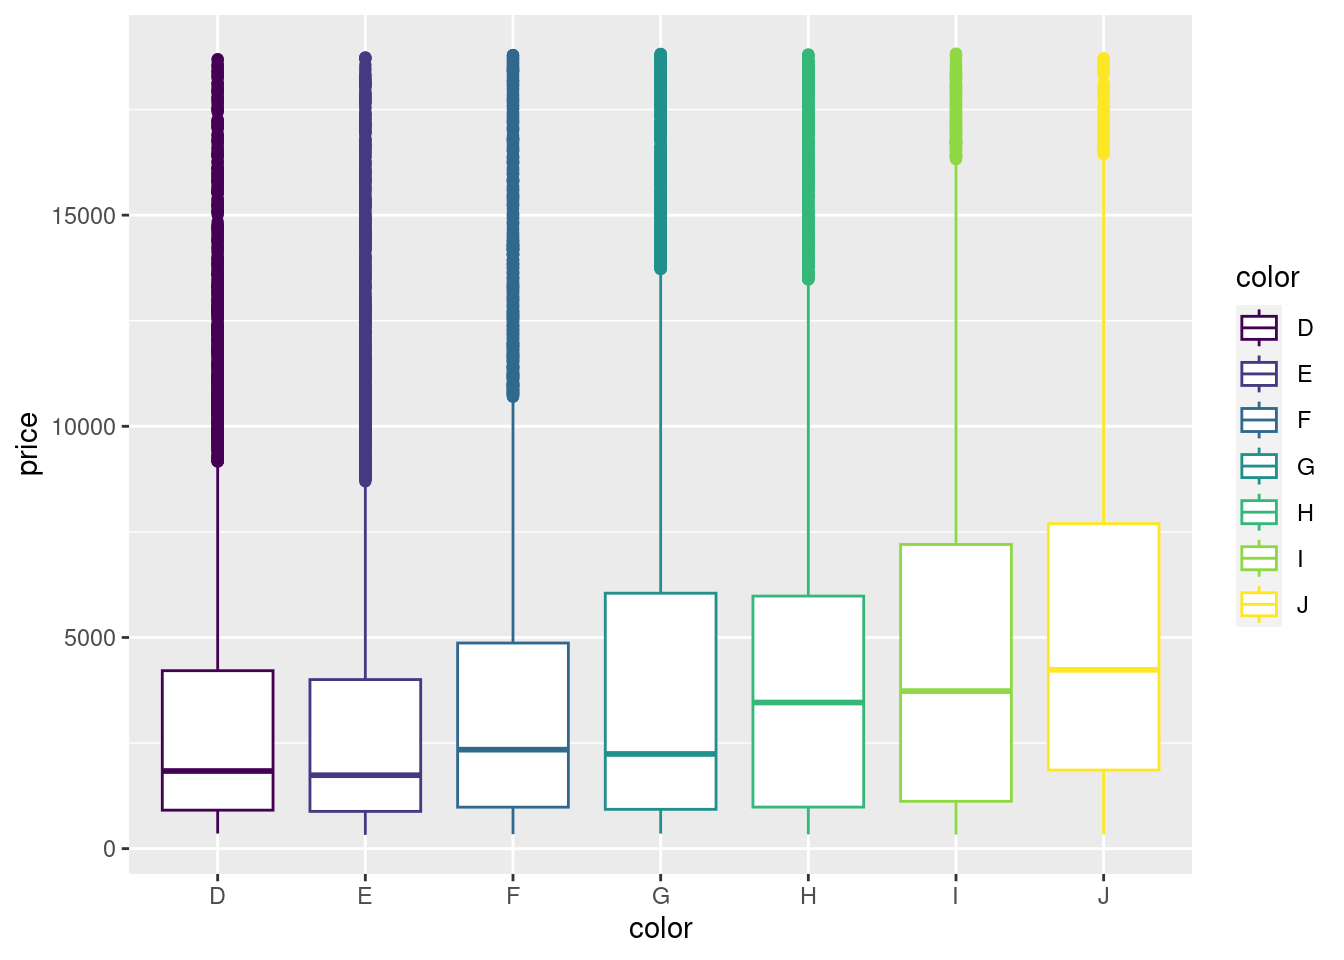
图 12.48: 不同颜色钻石的价格比较
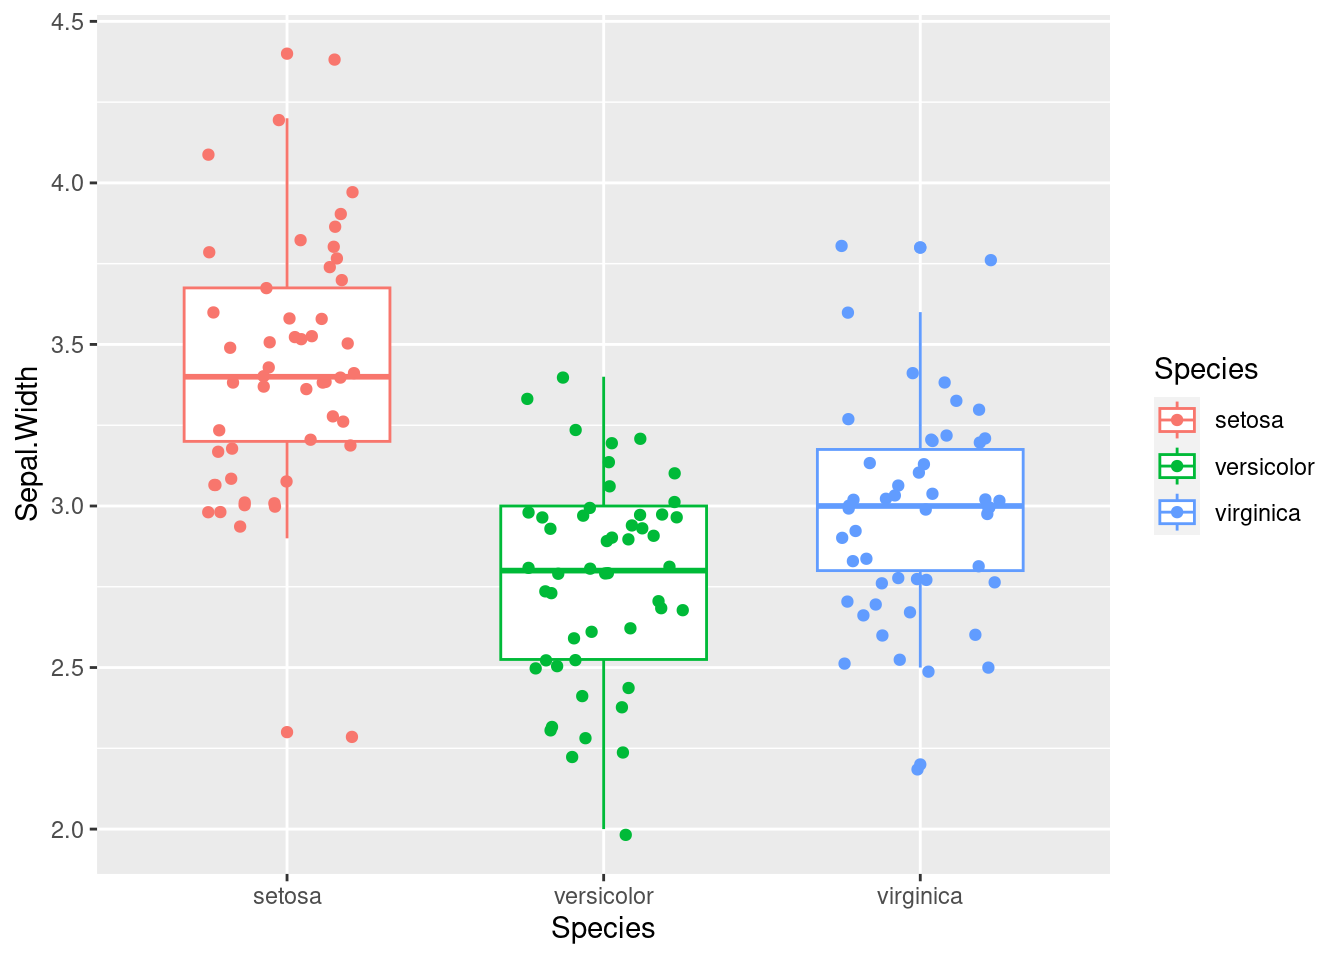
设置随机数种子,抖动图是可重复的。
ggplot(iris, aes(x = Species, y = Sepal.Width, color = Species)) +
  geom_boxplot(width = 0.65) +
  geom_point(position = position_jitter(seed = 37, width = 0.25))